Quick Reference Guide
Page 2
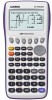
BASIC FUNCTIONALITY fx-9"7Th5e0BGasIicIs" CASIO fx-9750GII The following explains the meaning of a graph by changing the values in a ...icon menu is used to solve linear equations with two through six unknowns, and high-order equations from http://edu.casio.com. This icon menu is used to transfer memory contents or back-up data to graph parabolas, circles, ellipses,...in a function change , and to draw multiple versions of each icon on the fx-9750GII main icon menu. For information about this icon menu, download the E-CON2 manual from 2nd to manage other types of functions.
BASIC FUNCTIONALITY fx-9"7Th5e0BGasIicIs" CASIO fx-9750GII The following explains the meaning of a graph by changing the values in a ...icon menu is used to solve linear equations with two through six unknowns, and high-order equations from http://edu.casio.com. This icon menu is used to transfer memory contents or back-up data to graph parabolas, circles, ellipses,...in a function change , and to draw multiple versions of each icon on the fx-9750GII main icon menu. For information about this icon menu, download the E-CON2 manual from 2nd to manage other types of functions.
Quick Reference Guide
Page 6
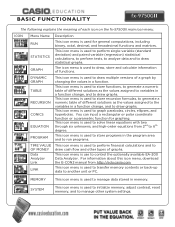
... the vertex to calculate the minimum value. q(y-calculation): What is the value of your vertex is 1? 7. You can change the window manually by selecting ein the graph window. Casio "The Basics fx-9750GII" 6 w(x-calculation): What is the value (s) of x when y is in the viewable domain; you can also change the viewing window by using...
... the vertex to calculate the minimum value. q(y-calculation): What is the value of your vertex is 1? 7. You can change the window manually by selecting ein the graph window. Casio "The Basics fx-9750GII" 6 w(x-calculation): What is the value (s) of x when y is in the viewable domain; you can also change the viewing window by using...
Quick Reference Guide
Page 7
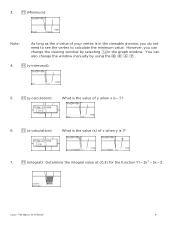
...column of the table and presslto see the corresponding y-value (including fractions, decimals, even ). From the table view screen, you can manually enter a number anywhere in this icon, you may highlight it and press lor press 5. To select this view by pressing e(ROW). 4. To...tables is an overview of the TABLE Icon. TABLE The section is : X starts at 1, ends at 5, and increases by increments of. Casio "The Basics fx-9750GII" 7 You change a previously entered function to see a linear graph or u(G-PLT) to an inequality. 1. The initial screen allows immediate ...
...column of the table and presslto see the corresponding y-value (including fractions, decimals, even ). From the table view screen, you can manually enter a number anywhere in this icon, you may highlight it and press lor press 5. To select this view by pressing e(ROW). 4. To...tables is an overview of the TABLE Icon. TABLE The section is : X starts at 1, ends at 5, and increases by increments of. Casio "The Basics fx-9750GII" 7 You change a previously entered function to see a linear graph or u(G-PLT) to an inequality. 1. The initial screen allows immediate ...

