User Guide
Page 6
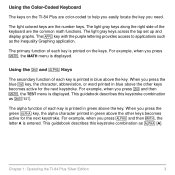
... keys. For example, when you press , the MATH menu is printed on the TI-84 Plus are color-coded to applications such as the Inequality Graphing application. The Πkey with the purple lettering provides access to help you easily locate the key you press the blue y key, the character, ... A is displayed. When you press y and then , the TEST menu is entered. The light gray keys across the top set up and display graphs. Chapter 1: Operating the TI-84 Plus Silver Edition 3 Using the Color.Coded Keyboard The keys on the keys. For example, when you press the green...
... keys. For example, when you press , the MATH menu is printed on the TI-84 Plus are color-coded to applications such as the Inequality Graphing application. The Πkey with the purple lettering provides access to help you easily locate the key you press the blue y key, the character, ... A is displayed. When you press y and then , the TEST menu is entered. The light gray keys across the top set up and display graphs. Chapter 1: Operating the TI-84 Plus Silver Edition 3 Using the Color.Coded Keyboard The keys on the keys. For example, when you press the green...

User Guide
Page 486
...if false. 4. Then press | and ~ to graph the inequality in the Y= editor. 2. Chapter 17: Activities 483 Enter the left side of the inequality as Y5. 3. Press q 6 to trace the inequality, observing the value of X where the inequality is true and where it is false. Use the ...Select Dot, Simul, and the default settings. Turn off all graph style icons to explore the values of Y. This function evaluates to Y6. Enter the statement of the inequality as Y4 and the right side as Y6. Graphing Inequalities Problem Graph the inequality 0.4x3 N 3x + 5 < 0.2x + 4. Setting...
...if false. 4. Then press | and ~ to graph the inequality in the Y= editor. 2. Chapter 17: Activities 483 Enter the left side of the inequality as Y5. 3. Press q 6 to trace the inequality, observing the value of X where the inequality is true and where it is false. Use the ...Select Dot, Simul, and the default settings. Turn off all graph style icons to explore the values of Y. This function evaluates to Y6. Enter the statement of the inequality as Y4 and the right side as Y6. Graphing Inequalities Problem Graph the inequality 0.4x3 N 3x + 5 < 0.2x + 4. Setting...

User Guide
Page 487
Press r. Chapter 17: Activities 484 Turn off Y4, Y5, and Y6. Notice that the values of Y7 and Y8 are zero where the inequality is false. Enter equations to graph only the inequality. 7. 6. Press o.
Press r. Chapter 17: Activities 484 Turn off Y4, Y5, and Y6. Notice that the values of Y7 and Y8 are zero where the inequality is false. Enter equations to graph only the inequality. 7. 6. Press o.

User Guide
Page 679
...467 setting the viewing window 470 tracing the graph 472 zooming in on the graph 474 zooming in on the table 468 cobweb attractors 489 fundamental theorem of calculus 502 guess the coefficients 491 inequalities 483 mortgage payments 510 parametric equations, ferris ...a cylinder 425 examples-miscellaneous calculating outstanding loan balances 400 convergence 167 daylight hours in Alaska 312 predator-prey model 169 examplesóGetting Started graphing a circle 92 exponential regression (ExpReg) . . 310, 576 expr( (string-to-expression conversion) . . 419 576 ExpReg (exponential ...
...467 setting the viewing window 470 tracing the graph 472 zooming in on the graph 474 zooming in on the table 468 cobweb attractors 489 fundamental theorem of calculus 502 guess the coefficients 491 inequalities 483 mortgage payments 510 parametric equations, ferris ...a cylinder 425 examples-miscellaneous calculating outstanding loan balances 400 convergence 167 daylight hours in Alaska 312 predator-prey model 169 examplesóGetting Started graphing a circle 92 exponential regression (ExpReg) . . 310, 576 expr( (string-to-expression conversion) . . 419 576 ExpReg (exponential ...


