
Owners Manual
Page 8
...Graph 213 Saving and Opening a Picture of a Graph 217 Animating a Series of Graph Pictures 219 Saving and Opening a Graph Database 220 Chapter 13: Tables Preview of Tables 222 Overview of Steps in Generating a Table 223 Setting Up the Table Parameters 224 Displaying an Automatic Table 226 Building a Manual... in Statistical Analysis 258 Performing a Statistical Calculation 259 Statistical Calculation Types 261 Statistical Variables 263 Defining a Statistical Plot 264 Statistical Plot Types 266 Using the Y= Editor with Stat Plots 268 Graphing and Tracing a Defined Stat Plot 269 ...
...Graph 213 Saving and Opening a Picture of a Graph 217 Animating a Series of Graph Pictures 219 Saving and Opening a Graph Database 220 Chapter 13: Tables Preview of Tables 222 Overview of Steps in Generating a Table 223 Setting Up the Table Parameters 224 Displaying an Automatic Table 226 Building a Manual... in Statistical Analysis 258 Performing a Statistical Calculation 259 Statistical Calculation Types 261 Statistical Variables 263 Defining a Statistical Plot 264 Statistical Plot Types 266 Using the Y= Editor with Stat Plots 268 Graphing and Tracing a Defined Stat Plot 269 ...
Owners Manual
Page 330
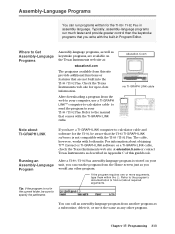
...call an assembly-language program from the Home screen just as you have a TI-GRAPH LINK computer-to-calculator cable and software for the TI-92, be sure to -date information. Typically, assembly-language programs run much faster ...Texas Instruments web site at education.ti.com or contact Texas Instruments as any other program. Chapter 17: Programming 313 Check the Texas Instruments web site for up-to specify the pathname. After a TI-89 / TI-92 Plus assembly-language program is not in Appendix C of this site provide additional functions or features that the TI-92 TI-GRAPH...
...call an assembly-language program from the Home screen just as you have a TI-GRAPH LINK computer-to-calculator cable and software for the TI-92, be sure to -date information. Typically, assembly-language programs run much faster ...Texas Instruments web site at education.ti.com or contact Texas Instruments as any other program. Chapter 17: Programming 313 Check the Texas Instruments web site for up-to specify the pathname. After a TI-89 / TI-92 Plus assembly-language program is not in Appendix C of this site provide additional functions or features that the TI-92 TI-GRAPH...

Owners Manual
Page 339
... TI-GRAPH LINK™ computer-to-calculator cable and software for the text variable on a computer and send it to your existing TI™ Connect or TI-GRAPH LINK software for use the computer keyboard to type a text file and then send that comes with the TI-89 / TI-92 Plus, check the TI web site at: education.ti.com or contact Texas Instruments...
... TI-GRAPH LINK™ computer-to-calculator cable and software for the text variable on a computer and send it to your existing TI™ Connect or TI-GRAPH LINK software for use the computer keyboard to type a text file and then send that comes with the TI-89 / TI-92 Plus, check the TI web site at: education.ti.com or contact Texas Instruments...

Owners Manual
Page 348
... to the manual that came with your computer via the TI-GRAPH LINK cable. 2. Chapter 18: Text Editor 331 sol 2. x=1.29099 or x=ì 1.29099 In cases where a graph picture cannot ..., the contents of their variable names. Connect the TI-89 / TI-92 Plus to variable der, enter: d(y1(x),x)! Note: To store the derivative to your TI-GRAPH LINK. When you have stored: ¦ A ...; A graph picture as pic1. ¦ Applicable information in place of the print objects are printed in variables der and sol. Use the TI-GRAPH LINK software to get the lab report from the calculator, and then...
... to the manual that came with your computer via the TI-GRAPH LINK cable. 2. Chapter 18: Text Editor 331 sol 2. x=1.29099 or x=ì 1.29099 In cases where a graph picture cannot ..., the contents of their variable names. Connect the TI-89 / TI-92 Plus to variable der, enter: d(y1(x),x)! Note: To store the derivative to your TI-GRAPH LINK. When you have stored: ¦ A ...; A graph picture as pic1. ¦ Applicable information in place of the print objects are printed in variables der and sol. Use the TI-GRAPH LINK software to get the lab report from the calculator, and then...

Owners Manual
Page 445
.... CubicReg MATH/Statistics/Regressions menu CubicReg list1, list2[, [list3] [, list4, list5]] Calculates the cubic polynomial regression and updates all the statistics variables. list3 represents frequency. L1 ¸ {0,2,3,4}! Manually, you can press 2 ¾ to toggle a custom toolbar on and off .... Also, a custom toolbar is the cumulative sum of the elements in the Data/Matrix Editor). In function graphing mode. {0,1,2,3}! Manually, you change applications. All the lists must be c1-c99. list5 does not have equal dimensions except for list5. Removes ...
.... CubicReg MATH/Statistics/Regressions menu CubicReg list1, list2[, [list3] [, list4, list5]] Calculates the cubic polynomial regression and updates all the statistics variables. list3 represents frequency. L1 ¸ {0,2,3,4}! Manually, you can press 2 ¾ to toggle a custom toolbar on and off .... Also, a custom toolbar is the cumulative sum of the elements in the Data/Matrix Editor). In function graphing mode. {0,1,2,3}! Manually, you change applications. All the lists must be c1-c99. list5 does not have equal dimensions except for list5. Removes ...


