Software User Guide
Page 3
... Unit and Display Format 2-12 4. Matrix Calculations...2-41 9. Switching between List Files 3-17 5. Modifying a Graph...5-36 9. Graphing a Conic Section 5-48 12. Binary, Octal, Decimal, and Hexadecimal Calculations with Integers 2-38 8. Manipulating List... 1-7 4. Drawing Dots, Lines, and Text on the Same Screen 5-23 6. Sample Graphs ...5-1 2. Drawing Two Graphs on the Graph Screen (Sketch 5-50 13. Manual Graphing...5-25 7. Graphing a Recursion Formula 5-43 11. Function Analysis ...5-52 ii Display ...1-3 3. Numerical Calculations ...
... Unit and Display Format 2-12 4. Matrix Calculations...2-41 9. Switching between List Files 3-17 5. Modifying a Graph...5-36 9. Graphing a Conic Section 5-48 12. Binary, Octal, Decimal, and Hexadecimal Calculations with Integers 2-38 8. Manipulating List... 1-7 4. Drawing Dots, Lines, and Text on the Same Screen 5-23 6. Sample Graphs ...5-1 2. Drawing Two Graphs on the Graph Screen (Sketch 5-50 13. Manual Graphing...5-25 7. Graphing a Recursion Formula 5-43 11. Function Analysis ...5-52 ii Display ...1-3 3. Numerical Calculations ...
Software User Guide
Page 4
... Day/Date Calculations 7-14 9. File Management ...8-6 5. Conditional Formatting 9-21 5. eActivity Overview...10-1 2. Calculating and Graphing Paired-Variable Statistical Data (Curve Fitting 6-14 4. Cost, Selling Price, Margin 7-13 8. Program Mode Function Keys 8-2... Command List 8-51 8. CASIO Scientific Function Calculator Special Commands ⇔ Text Conversion Table 8-59 9. Drawing Statistical Graphs, and Performing Statistical and Regression Calculations...9-27 6. eActivity File Operations 10-4 4. Calculating and Graphing Single-Variable Statistical Data 6-8...
... Day/Date Calculations 7-14 9. File Management ...8-6 5. Conditional Formatting 9-21 5. eActivity Overview...10-1 2. Calculating and Graphing Paired-Variable Statistical Data (Curve Fitting 6-14 4. Cost, Selling Price, Margin 7-13 8. Program Mode Function Keys 8-2... Command List 8-51 8. CASIO Scientific Function Calculator Special Commands ⇔ Text Conversion Table 8-59 9. Drawing Statistical Graphs, and Performing Statistical and Regression Calculations...9-27 6. eActivity File Operations 10-4 4. Calculating and Graphing Single-Variable Statistical Data 6-8...
Software User Guide
Page 5
...Con2 Overview ...ε-1 2. Using a Custom Probe 19 5. Using the Plot Function 15-7 4. Using the Setup Wizard 2 3. Graph Analysis Tool Graph Screen Operations 39 12. Calling E-Con2 Functions from an eActivity 50 iv Using Setup Memory 24 7. Using Sample Data Memory 33 10... Controlling the Appearance of the Geometry Window 14-33 4. System Settings ...12-1 Chapter 13 Data Communication 1. Using the Graph Analysis Tools to a Projector 13-16 Chapter 14 Geometry 1. Performing Data Communication between the Calculator and a Personal Computer 13-3 2. Working...
...Con2 Overview ...ε-1 2. Using a Custom Probe 19 5. Using the Plot Function 15-7 4. Using the Setup Wizard 2 3. Graph Analysis Tool Graph Screen Operations 39 12. Calling E-Con2 Functions from an eActivity 50 iv Using Setup Memory 24 7. Using Sample Data Memory 33 10... Controlling the Appearance of the Geometry Window 14-33 4. System Settings ...12-1 Chapter 13 Data Communication 1. Using the Graph Analysis Tools to a Projector 13-16 Chapter 14 Geometry 1. Performing Data Communication between the Calculator and a Personal Computer 13-3 2. Working...
Software User Guide
Page 10
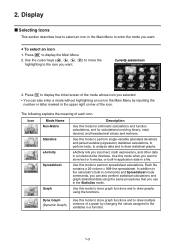
...use in the upper right corner of the icon. Use this mode when you want . u To select an icon 1. eActivity Spreadsheet Graph eActivity lets you want to store text or formulas, or built-in application data in the Main Menu to select an icon in a ... move the highlighting to draw multiple versions of each icon. Statistics Use this mode to store graph functions and to the icon you input text, math expressions, and other data in a function. 1-3 Dyna Graph (Dynamic Graph) Use this mode to perform single-variable (standard deviation) and paired-variable (regression) statistical ...
...use in the upper right corner of the icon. Use this mode when you want . u To select an icon 1. eActivity Spreadsheet Graph eActivity lets you want to store text or formulas, or built-in application data in the Main Menu to select an icon in a ... move the highlighting to draw multiple versions of each icon. Statistics Use this mode to store graph functions and to the icon you input text, math expressions, and other data in a function. 1-3 Dyna Graph (Dynamic Graph) Use this mode to perform single-variable (standard deviation) and paired-variable (regression) statistical ...
Software User Guide
Page 11
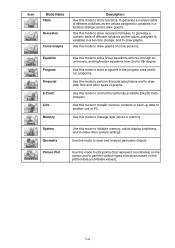
...recursion formulas, to generate a numeric table of different solutions as the values assigned to variables in a function change , and to draw graphs. Use this mode to store programs in the program area and to run programs. Use this mode to perform financial calculations and to ... Geometry Use this mode to initialize memory, adjust display brightness, and to manage data stored in memory. Icon Mode Name Table Recursion Conic Graphs Description Use this mode to store functions, to generate a numeric table of different solutions as the values assigned to variables in a function change...
...recursion formulas, to generate a numeric table of different solutions as the values assigned to variables in a function change , and to draw graphs. Use this mode to store programs in the program area and to run programs. Use this mode to perform financial calculations and to ... Geometry Use this mode to initialize memory, adjust display brightness, and to manage data stored in memory. Icon Mode Name Table Recursion Conic Graphs Description Use this mode to store functions, to generate a numeric table of different solutions as the values assigned to variables in a function change...

Software User Guide
Page 13
Text Screen Graph Screen k Normal Display The calculator normally displays values up to and displayed in exponential format. This means that the result is positive. You can show ... to 1.2 × 10⁻³. Norm 1 10-2 (0.01) > |x|, |x| > 1010 Norm 2 10-9 (0.000000001) > |x|, |x| > 1010 All of characters, with the bottom line used for the function key menu. The graph screen uses an area that exceed this manual show 21 columns and 8 lines of the examples in 1.2 three places to the left, because the exponent...
Text Screen Graph Screen k Normal Display The calculator normally displays values up to and displayed in exponential format. This means that the result is positive. You can show ... to 1.2 × 10⁻³. Norm 1 10-2 (0.01) > |x|, |x| > 1010 Norm 2 10-9 (0.000000001) > |x|, |x| > 1010 All of characters, with the bottom line used for the function key menu. The graph screen uses an area that exceed this manual show 21 columns and 8 lines of the examples in 1.2 three places to the left, because the exponent...
Software User Guide
Page 32
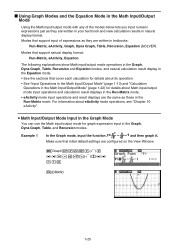
...input/output mode with any of expressions as they are configured on the View Window. u Math Input/Output Mode Input in the Graph Mode You can use the Math input/output mode for details about Math input/output mode input operations and calculation result displays in ...Run-Matrix mode. • eActivity mode input operations and result displays are the same as they are written in textbooks: Run-Matrix, eActivity, Graph, Dyna Graph, Table, Recursion, Equation (SOLVER) Modes that support natural display format: Run-Matrix, eActivity, Equation The following explanations show Math input/output ...
...input/output mode with any of expressions as they are configured on the View Window. u Math Input/Output Mode Input in the Graph Mode You can use the Math input/output mode for details about Math input/output mode input operations and calculation result displays in ...Run-Matrix mode. • eActivity mode input operations and result displays are the same as they are written in textbooks: Run-Matrix, eActivity, Graph, Dyna Graph, Table, Recursion, Equation (SOLVER) Modes that support natural display format: Run-Matrix, eActivity, Equation The following explanations show Math input/output ...

Software User Guide
Page 33
... can use the Math input/output mode in the Equation mode mEquation!m(SET UP) cccc(Complex Mode) 2(a+bi)J 2(POLY)1(2)bwdwfww 1-26 Example 2 ∫ In the Graph mode, input the function...
... can use the Math input/output mode in the Equation mode mEquation!m(SET UP) cccc(Complex Mode) 2(a+bi)J 2(POLY)1(2)bwdwfww 1-26 Example 2 ∫ In the Graph mode, input the function...
Software User Guide
Page 34
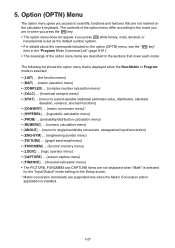
... calculation menu} • {NUMERIC} ... {numeric calculation menu} • {ANGLE} ... {menu for angle/coordinate conversion, sexagesimal input/conversion} • {ENG-SYM} ... {engineering symbol menu} • {PICTURE} ... {graph save/recall menu} • {FUNCMEM} ... {function memory menu} • {LOGIC} ... {logic operator menu} • {CAPTURE} ... {screen capture menu} • {FINANCE} ... {financial calculation menu} • The...
... calculation menu} • {NUMERIC} ... {numeric calculation menu} • {ANGLE} ... {menu for angle/coordinate conversion, sexagesimal input/conversion} • {ENG-SYM} ... {engineering symbol menu} • {PICTURE} ... {graph save/recall menu} • {FUNCMEM} ... {function memory menu} • {LOGIC} ... {logic operator menu} • {CAPTURE} ... {screen capture menu} • {FINANCE} ... {financial calculation menu} • The...
Software User Guide
Page 35
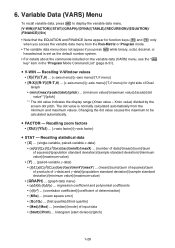
... }/{sum}/{sum of squares}/{sum of products of x-data and y-data}/{population standard deviation}/{sample standard deviation}/{minimum value}/{maximum value} • {GRAPH} ... {graph data menu} • {a}/{b}/{c}/{d}/{e} ... Recalling zoom factors • {Xfct}/{Yfct} ... {x-axis factor}/{y-axis factor} u STAT - Recalling statistical data...} • {Q1}/{Q3} ... {first quartile}/{third quartile} • {Med}/{Mod} ... {median}/{mode} of Dual Graph • {min}/{max}/{scale}/{dot}/{pitch} ... {minimum value}/{maximum value}/{scale}/{dot value*1}/{pitch} *1 The dot value indicates...
... }/{sum}/{sum of squares}/{sum of products of x-data and y-data}/{population standard deviation}/{sample standard deviation}/{minimum value}/{maximum value} • {GRAPH} ... {graph data menu} • {a}/{b}/{c}/{d}/{e} ... Recalling zoom factors • {Xfct}/{Yfct} ... {x-axis factor}/{y-axis factor} u STAT - Recalling statistical data...} • {Q1}/{Q3} ... {first quartile}/{third quartile} • {Med}/{Mod} ... {median}/{mode} of Dual Graph • {min}/{max}/{scale}/{dot}/{pitch} ... {minimum value}/{maximum value}/{scale}/{dot value*1}/{pitch} *1 The dot value indicates...
Software User Guide
Page 36
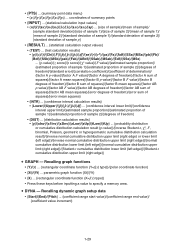
... data • {Start}/{End}/{Pitch} ... {coefficient range start value}/{coefficient range end value}/ {coefficient value increment} 1-29 u DYNA - Recalling graph functions • {Y}/{r} ... {rectangular coordinate function (Y=f(x) type)}/{polar coordinate function} • {Xt}/{Yt} ... coordinates of summary points • {INPUT} ... {statistical ...limit (right edge)}/{Student-t cumulative distribution lower limit (left edge)}/{Student-t cumulative distribution upper limit (right edge)} u GRAPH - • {PTS} ... {summary point data menu} • {x1}/{y1}/{x2}/{y2}/{x3}/{y3} ...
... data • {Start}/{End}/{Pitch} ... {coefficient range start value}/{coefficient range end value}/ {coefficient value increment} 1-29 u DYNA - Recalling graph functions • {Y}/{r} ... {rectangular coordinate function (Y=f(x) type)}/{polar coordinate function} • {Xt}/{Yt} ... coordinates of summary points • {INPUT} ... {statistical ...limit (right edge)}/{Student-t cumulative distribution lower limit (left edge)}/{Student-t cumulative distribution upper limit (right edge)} u GRAPH - • {PTS} ... {summary point data menu} • {x1}/{y1}/{x2}/{y2}/{x3}/{y3} ...
Software User Guide
Page 37
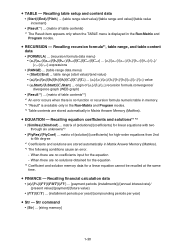
... no coefficients input for linear equations with two through six unknowns*3 • {PlyRes}/{PlyCoef} ... u TABLE - origin of {an}/{bn}/{cn} recursion formula convergence/ divergence graph (WEB graph) • {Result*2} ... {matrix of table contents} *1 The Result item appears only when the TABLE menu is available only in the Run-Matrix and Program modes...
... no coefficients input for linear equations with two through six unknowns*3 • {PlyRes}/{PlyCoef} ... u TABLE - origin of {an}/{bn}/{cn} recursion formula convergence/ divergence graph (WEB graph) • {Result*2} ... {matrix of table contents} *1 The Result item appears only when the TABLE menu is available only in the Run-Matrix and Program modes...
Software User Guide
Page 40
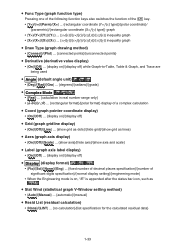
u Func Type (graph function type) Pressing one of the following function keys also switches the function of the v key. • {Y=}/{r=}/{Parm}/{X=} ... {rectangular coordinate (Y= f (x) type)}/{polar coordinate}/ {parametric}/{rectangular coordinate (X= f (y) type)} graph • {Y>}/{Yf(x)}/{y}/{Xf(y)}/{x
u Func Type (graph function type) Pressing one of the following function keys also switches the function of the v key. • {Y=}/{r=}/{Parm}/{X=} ... {rectangular coordinate (Y= f (x) type)}/{polar coordinate}/ {parametric}/{rectangular coordinate (X= f (y) type)} graph • {Y>}/{Yf(x)}/{y}/{Xf(y)}/{x

Software User Guide
Page 41
...file on the display} u Sub Name (list naming) • {On}/{Off} ... {display on}/{display off} u Graph Func (function display during graph drawing and trace) • {On}/{Off} ... {display on}/{display off} u Dual Screen (dual screen mode status) • {G+G}/{...}/{Off} ... {graphing on both sides of dual screen}/{graph on one side and numeric table on the other side of dual screen}/{dual screen off} u Simul Graph (simultaneous graphing mode) • {On}/{Off} ... {simultaneous graphing on (all graphs drawn simultaneously)}/{simultaneous graphing off (graphs drawn in recursion table...
...file on the display} u Sub Name (list naming) • {On}/{Off} ... {display on}/{display off} u Graph Func (function display during graph drawing and trace) • {On}/{Off} ... {display on}/{display off} u Dual Screen (dual screen mode status) • {G+G}/{...}/{Off} ... {graphing on both sides of dual screen}/{graph on one side and numeric table on the other side of dual screen}/{dual screen off} u Simul Graph (simultaneous graphing mode) • {On}/{Off} ... {simultaneous graphing on (all graphs drawn simultaneously)}/{simultaneous graphing off (graphs drawn in recursion table...
Software User Guide
Page 42
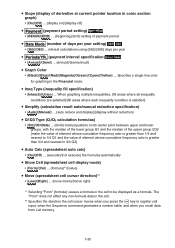
... payment period u Date Mode (number of days per year u Periods/YR. (payment interval specification) • {Annual}/{Semi} ... {annual}/{semiannual} u Graph Color • {Black}/{Blue}/{Red}/{Magenta}/{Green}/{Cyan}/{Yellow} ... The "Form" does not affect any non-formula data in the cell to register cell ... from List memory. 1-35 u Ineq Type (inequality fill specification) • {Intsect}/{Union} ... Specifies a single line color for graphing in conic section graph) • {On}/{Off} ... {display on its center point between upper and lower groups, with the median of the lower group...
... payment period u Date Mode (number of days per year u Periods/YR. (payment interval specification) • {Annual}/{Semi} ... {annual}/{semiannual} u Graph Color • {Black}/{Blue}/{Red}/{Magenta}/{Green}/{Cyan}/{Yellow} ... The "Form" does not affect any non-formula data in the cell to register cell ... from List memory. 1-35 u Ineq Type (inequality fill specification) • {Intsect}/{Union} ... Specifies a single line color for graphing in conic section graph) • {On}/{Off} ... {display on its center point between upper and lower groups, with the median of the lower group...
Software User Guide
Page 44
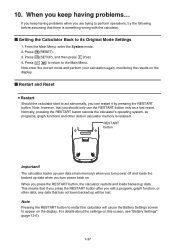
... button. When you keep having problems... Note, however, that if you press the RESTART button after you edit a program, graph function, or other data in calculator memory is something wrong with the calculator. Note Pressing the RESTART button to restart the calculator... this screen, see "Battery Settings" (page 12-6). 1-37 Normally, pressing the RESTART button reboots the calculator's operating system, so programs, graph functions and other data, any data that there is retained. RESTART buttun Important! For details about the settings on the display. k Restart and...
... button. When you keep having problems... Note, however, that if you press the RESTART button after you edit a program, graph function, or other data in calculator memory is something wrong with the calculator. Note Pressing the RESTART button to restart the calculator... this screen, see "Battery Settings" (page 12-6). 1-37 Normally, pressing the RESTART button reboots the calculator's operating system, so programs, graph functions and other data, any data that there is retained. RESTART buttun Important! For details about the settings on the display. k Restart and...

Software User Guide
Page 45
... power back on, and there is the danger that memory contents will be corrupted or lost entirely. • You will not be compatible with the fx-CG10. • "To capture a screen image" (page 1-36) • "To update the background image V-Window settings with current V-Window settings" (...page 5-11) • "Adjusting the Lightness (Fade I/O) of the Background Image" (page 5-12) • "Saving Graph Screen Contents as an Image (g3p File)" (page 5-21) • "Saving Current Screen Contents as instructed. For details, see "Reset" (page 12-4). k...
... power back on, and there is the danger that memory contents will be corrupted or lost entirely. • You will not be compatible with the fx-CG10. • "To capture a screen image" (page 1-36) • "To update the background image V-Window settings with current V-Window settings" (...page 5-11) • "Adjusting the Lightness (Fade I/O) of the Background Image" (page 5-12) • "Saving Graph Screen Contents as an Image (g3p File)" (page 5-21) • "Saving Current Screen Contents as instructed. For details, see "Reset" (page 12-4). k...
Software User Guide
Page 49
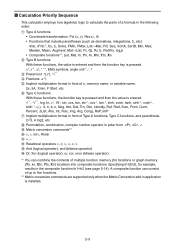
... operator), and (bitwise operator) $ Or, Xor (logical operator), or, xor, xnor (bitwise operator) *1 You can combine the contents of multiple function memory (fn) locations or graph memory (Yn, rn, Xtn, Ytn, Xn) locations into composite functions. x2, x-1, x!, ° ' ", ENG symbols, angle unit °, r, g 3 Power/root ^(xy), x' 4 Fractions a b/c 5 Implied multiplication format in...
... operator), and (bitwise operator) $ Or, Xor (logical operator), or, xor, xnor (bitwise operator) *1 You can combine the contents of multiple function memory (fn) locations or graph memory (Yn, rn, Xtn, Ytn, Xn) locations into composite functions. x2, x-1, x!, ° ' ", ENG symbols, angle unit °, r, g 3 Power/root ^(xy), x' 4 Fractions a b/c 5 Implied multiplication format in...

Software User Guide
Page 55
... expressions. In this case, you store a function already contains a function, the previous function is replaced with the new one. • You can also use the Graph mode for expressions and the Program mode for temporary storage of double quotation marks. 2-9 It cannot be performed in the Math input/output mode. u Function...
... expressions. In this case, you store a function already contains a function, the previous function is replaced with the new one. • You can also use the Graph mode for expressions and the Program mode for temporary storage of double quotation marks. 2-9 It cannot be performed in the Math input/output mode. u Function...

Software User Guide
Page 74
... points in x values - inclusion of the value a. inclusion of undifferentiable points in x values - dw Using First Derivative Calculation in a Graph Function • You can omit input of the value a in the syntax on the display) interrupts the calculation. • Inaccurate results and... calculation. • Pressing A during calculation of a first derivative (while the cursor is not shown on page 2-27 by the following format for the first derivative graph: Y2 = d/dx (Y1). In this case, the value of the X variable is used as : f (a + Ax) - inclusion of the inflection point in x ...
... points in x values - inclusion of the value a. inclusion of undifferentiable points in x values - dw Using First Derivative Calculation in a Graph Function • You can omit input of the value a in the syntax on the display) interrupts the calculation. • Inaccurate results and... calculation. • Pressing A during calculation of a first derivative (while the cursor is not shown on page 2-27 by the following format for the first derivative graph: Y2 = d/dx (Y1). In this case, the value of the X variable is used as : f (a + Ax) - inclusion of the inflection point in x ...


