Casio FX9860GII Support Question
Casio FX9860GII Support Question
Find answers below for this question about Casio FX9860GII - Graph Calcltr W/Usb.Need a Casio FX9860GII manual? We have 1 online manual for this item!
Question posted by Rootty on February 21st, 2024
How To Use This Calculator To Solve Graph In Mathematics
How can I solve graph in mathematics with this calculator
Current Answers
Answer #1: Posted by Technicalproblemsolver on February 22nd, 2024 6:03 AM
Technicalproblemsolver

Member since:
September 25th, 2023 Points: 190,500

Member since:
September 25th, 2023 Points: 190,500
The Casio FX-9860GII calculator has a built-in graphing function that can be used to solve a variety of mathematical problems. To use the graphing function, follow these steps:
- Press the "GRAPH" button to enter the graphing mode.
- Press the "F3" button to select the type of function you want to graph. The options are:
- Linear
- Quadratic
- Cubic
- Exponential
- Logarithmic
- Sine
- Cosine
- Tangent
"Hi there,
I hope my response was helpful in addressing your question or concern. If you found it valuable, I kindly ask you to consider accepting my answer by clicking the designated button. Your support will not only acknowledge my efforts but also guide others in finding useful solutions. Thank you for your trust and I'm ready to assist you further if needed.
Best regards,
Technicalproblemsolver"
Related Casio FX9860GII Manual Pages
User Guide - Page 4
...
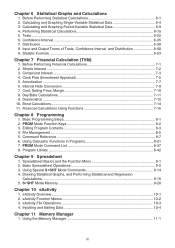
1. PRGM Mode Function Keys 8-2 3. Calculating and Graphing Paired-Variable Statistical Data 6-9 4. Compound Interest...7-3 4. Interest Rate Conversion 7-9 7. Using the Memory Manager 11-1
iii Cash Flow (Investment Appraisal 7-5 5. eActivity Overview...10-1 2. Distribution ...6-38 8. Depreciation ...7-12 10. Using Calculator Functions in Programs 8-21 7. PRGM...
User Guide - Page 41
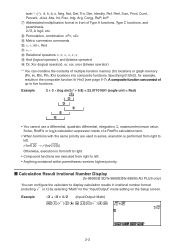
tanh-1, (-), d, h, b, o, Neg, Not, Det, Trn, Dim, Identity, Ref, Rref, Sum, Prod, Cuml, Percent, List, Abs, Int, Frac, Intg, Arg, Conjg, ReP, ImP Abbreviated multiplication format in front of Type A functions, Type C functions, and parenthesis. 23, A log2, etc.
Permutation, combination nPr, nCr
Metric conversion commands s, ÷, Int÷, Rnd +, - Relational operators =, x, >,
User Guide - Page 60
... "F=".
This type of 9
AFEBU*(CALC)* (E)(E)(Simp)HU
* fx-7400GII: (CALC)
The "F=" value is the divisor. 27 = 3 63 7
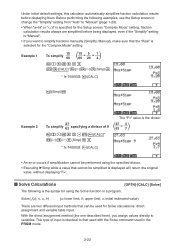
• An error occurs if simplification cannot be performed using the Solve function in the PRGM mode.
2-22 Under initial default settings, this calculator automatically simplifies fraction calculation results before being displayed, even if the "Simplify" setting...
User Guide - Page 62
... of a differential (while the cursor is not shown on the display)
interrupts the calculation.
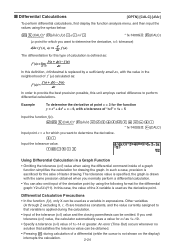
2-24 I Differential Calculations
[OPTN]-[CALC]-[d/dx]
To perform differential calculations, first display the function analysis menu, and then input the values using the syntax below.
*(CALC)* (d/dx) f(x)
a
tol
* fx-7400GII: (CALC)
(a: point for which you want to determine the derivative, tol...
User Guide - Page 101
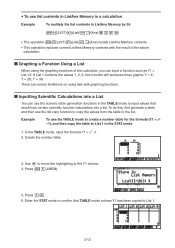
... list copy function to List 1.
3-12 To do this function will produces three graphs: Y = X, Y = 2X, Y = 3X. Use C to move the highlighting to the list. Press *(LMEM).
5. I Graphing a Function Using a List
When using lists with the result of this calculator, you can use the numeric table generation functions in the STAT mode
1.
Create the number table.
3. Enter the...
User Guide - Page 104
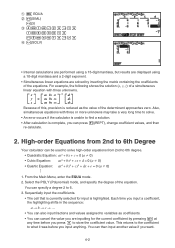
... the EQUA mode. 2. This returns to the coefficient to what it was before you press U to find a solution.
• After calculation is reduced as coefficients. • You can be used to solve high-order equations from 2nd to 6. 3. You can also input fractions and values assigned to variables as the value of the...
User Guide - Page 139
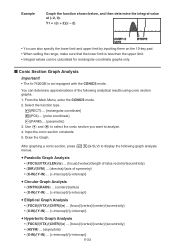
... results using conic section graphs. 1. Draw the Graph. Y1 = x(x + 2)(x - 2)
• You can also specify the lower limit and upper limit by inputting them on the 10-key pad. • When setting the range, make sure that the lower limit is not equipped with the CONICS mode.
I Conic Section Graph Analysis
Important! • The fx-7400G...
User Guide - Page 141
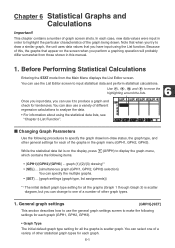
... menu, which contains the following settings for each graph.
6-1 In each graph (GPH1, GPH2, GPH3).
• Graph Type The initial default graph type setting for all the graphs is scatter diagram, but you have input using the statistical data lists, see "Chapter 3 List Function". Chapter 6 Statistical Graphs and Calculations
Important!
Note that when you try to draw a similar...
User Guide - Page 144
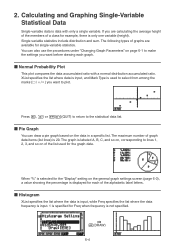
.... 1 is specified for Freq when frequency is used for single-variable statistics. Calculating and Graphing Single-Variable Statistical Data
Single-variable data is selected for the "Display" setting on of graphs are calculating the average height of the members of a class for each graph.
You can draw a pie graph based on page 6-1 to the statistical data list...
User Guide - Page 145
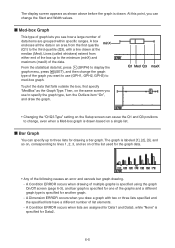
... the data in an area from
either end of the graphs and a different graph type is drawn. At this point, you want to use to med-box graph. A Condition ERROR occurs when drawing of multiple graphs is specified using the graph On/Off screen (page 6-3), and bar graph is specified for one of the box up to change...
User Guide - Page 158
...
1014
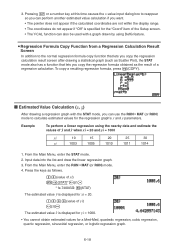
1. A?(value of xi) *(STAT)*(ţ)U
* fx-7400GII: (STAT) The estimated value ţ is displayed...Calculation Result Screen
In addition to calculate estimated values for the regression graph's x and y parameters. I Estimated Value Calculation ( , )
After drawing a regression graph with a graph drawn by using the nearby data and estimate the
values of a regression calculation...
User Guide - Page 164
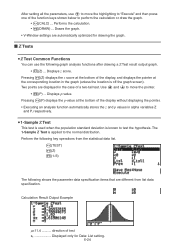
... deviation is applied to test the hypothesis. The
1-Sample Z Test is known to the normal distribution. Calculation Result Output Example
Mx11.4 .......... I Z Tests
S Z Test Common Functions
You can use A to perform the calculation or draw the graph.
• (CALC) ... Use B and C to move the highlighting to "Execute" and then press one of test sx Displayed only...
User Guide - Page 166
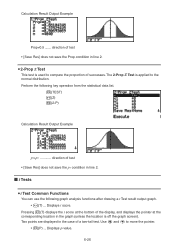
Calculation Result Output Example
Propx0.5 ....... Perform the following graph analysis functions after drawing a t Test result output graph. • (T) ... Pressing (T) displays the t score at the
corresponding location in the case of successes. Use B and C to the
normal distribution.
Two points are displayed in the graph (unless the location is off the graph screen). The 2-...
User Guide - Page 169
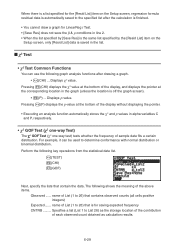
...I Ƶ2 Test
• Ƶ2 Test Common Functions
You can be used to 26) that contains observed counts (all cells positive integers)
Expected....... Pressing ...test) tests whether the frequency of the above items.
Observed ...... The following graph analysis functions after the calculation is finished.
• You cannot draw a graph for LinearReg t Test.
• [Save Res] does not save the...
User Guide - Page 171
... variable and one dependent variable.
6-31
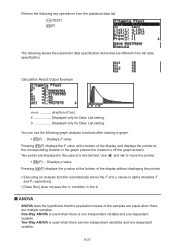
Calculation Result Output Example
S1xS2 direction of a two-tail test. Displays p-value. I ANOVA
ANOVA tests the hypothesis that are different from the statistical data list. (TEST) (F)
The following graph analysis functions after drawing a graph.
• (F) ...
You can use the following shows the parameter data specification...
User Guide - Page 173
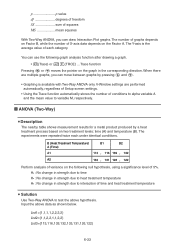
... conditions to alpha variable A and the mean squares
With Two-Way ANOVA, you can move between graphs by a heat treatment process based on the graph in strength due to interaction of time and heat treatment temperature
S Solution
Use Two-Way ANOVA to test the above data as shown below. I ANOVA (Two-Way)
S Description...
User Guide - Page 197
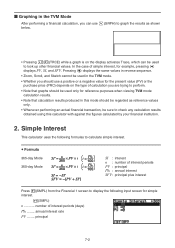
...' SFV = -(PV + SI' )
SI : interest n : number of calculation you are trying to perform.
• Note that graphs should be used only for reference purposes when viewing TVM mode calculation results.
• Note that calculation results produced in the TVM Mode
After performing a financial calculation, you can use (GRPH) to graph the results as shown below.
• Pressing (TRCE...
User Guide - Page 235
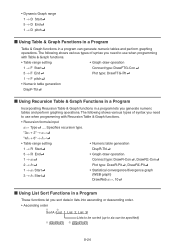
...DrawR-Plt=, DrawR3-Plt=
1 m an Start= 3 m bn Start=
• Statistical convergence/divergence graph (WEB graph)
DrawWeb an+1, 10=
I Using List Sort Functions in a Program
These functions let you sort data in a program lets you need to use when programming with Recursion Table & Graph functions.
• Recursion formula input
an+1 Type= .... Specifies recursion type.
• Dynamic...
User Guide - Page 270
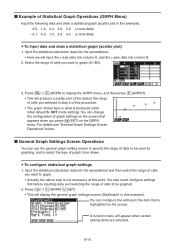
... Operations
You can use the general graph setting screen to specify the range of data to be used for the item that is highlighted on the screen that appears when you want to graph. • Actually, the above step is produced under initial default S • SHT mode settings. Input the statistical calculation data into column...
User Guide - Page 323
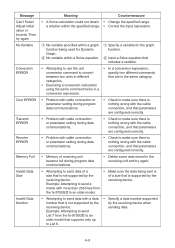
... of a
• Make sure the data being used for Dynamic Graph.
No variable within a Solve equation.
Specify a variable for the graph function.
Input a Solve equation that includes a variable.
• Attempting to use the unit conversion command to convert between two units in different categories.
• Executing a conversion calculation using the same command twice in a conversion...
Similar Questions

Argument Error In Graphs
I'm trying to make graphics using the calculator but there is a persisten problem which is the argum...
I'm trying to make graphics using the calculator but there is a persisten problem which is the argum...
(Posted by stgrueda2024 2 years ago)

Testing Solutions Using Casio 9860gii Calculator
I am a teacher and have been encouraging my students to purchase the Casio graphing calculators as t...
I am a teacher and have been encouraging my students to purchase the Casio graphing calculators as t...
(Posted by goodkarmacreationz 7 years ago)

How Do I Find The Y Value On The X Axis When Using A Casio Graphing Fx-9750gii
calculator
calculator
(Posted by dwillphc 10 years ago)

By Using Calculator Model Fx-100ms How Can I Change A Number From Binary To
decimal
decimal
(Posted by awTawniB 10 years ago)

Piece Wise Graphs
how can I get the calculator to do piece wise graphs. for eg y=3-x^2 if x=1
how can I get the calculator to do piece wise graphs. for eg y=3-x^2 if x=1
(Posted by isaactho 11 years ago)