Casio FX9750GII Support Question
Casio FX9750GII Support Question
Find answers below for this question about Casio FX9750GII - 0CALCULATOR GRAPHIC.Need a Casio FX9750GII manual? We have 1 online manual for this item!
Question posted by dwillphc on April 6th, 2014
How Do I Find The Y Value On The X Axis When Using A Casio Graphing Fx-9750gii
calculator
Current Answers
Related Casio FX9750GII Manual Pages
User Guide - Page 5
... the System Manager 12-1 2. Connecting the Calculator to Graph Data 11 Graph Analysis Tool Graph Screen Operations 12 Calling E-CON2 Functions from an eActivity
iv Data Communications Precautions 13-5 5. Formatting an SD Card 14-3 3. Using an SD Card ...14-1 2. SD Card Precautions during Use 14-3
Appendix
1. Performing a Data Communication Operation 13-2 4. Connecting Two Units...
User Guide - Page 45
...
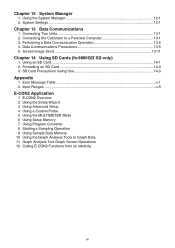
S To assign the same value to the display
?( A -LOCK)$(")T(A) J(B)((C)$(")?(Releases Alpha Lock.) ?)(E)(Str)*@U
(Str)*@U
* fx-7400GII: (Str)
String is convenient for programs.
• {STO}/{RCL}/{fn}/{SEE} ... {function store}/{function recall}/{function area specification as a variable name inside functions and commands that you use the GRAPH mode for expressions and the PRGM...
User Guide - Page 59
...}/{FMax}/{3(}/{logab} ... {minimum value}/{maximum value}/{summation}/{logarithm logab}
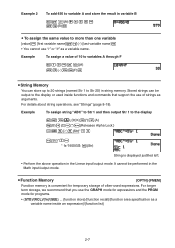
I Quotient of 107 ÷ 7
@?F*(CALC)*(E) (E)(Rmdr)F U
* fx-7400GII: (CALC)
I Remainder of Integer ÷ Integer
[OPTN]-[CALC]-[Rmdr]
The "Rmdr" function can be used to determine the quotient when one integer is on the display.
• {Simp} n U ... Example
To calculate the remainder of...
User Guide - Page 62

...values using the syntax below.
*(CALC)* (d/dx) f(x)
a
tol
* fx-7400GII: (CALC)
(a: point for which you want to perform differential calculations. An error (Time Out) occurs whenever no
solution that variable is applied during calculation of a differential (while the cursor is sacrificed for tol as :
f ' (a) = Alixm0-f-(-a-+-A-A-xx)----f-(-a-)
In this case, the value of a graph...
User Guide - Page 63
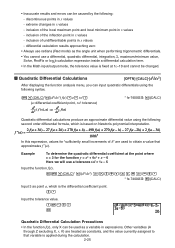
...d2/dx2) f(x)
a
tol (a: differential coefficient point, tol: tolerance)
-dd-x2-2 ( f (x), a) -dd-x-22 f (a)
* fx-7400GII: (CALC)
Quadratic differential calculations produce an approximate differential value using the following :
- differential calculation results approaching zero • Always use radians (Rad mode) as the angle unit when performing trigonometric differentials. •...
User Guide - Page 65
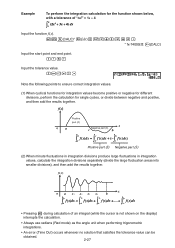
... the following points to ensure correct integration values.
(1) When cyclical functions for integration values become positive or negative for different divisions, perform the calculation for the function shown below,
with a tolerance of an integral (while the cursor is not shown on the display) interrupts the calculation.
• Always use radians (Rad mode) as the angle...
User Guide - Page 66
...?
(K)
A
E
@U
* fx-7400GII: (CALC)
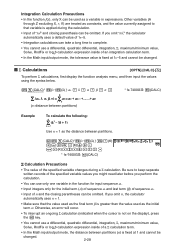
3 Calculation Precautions
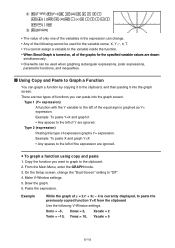
• The value of the specified variable changes during the calculation.
• Input of the specified variable values you might need later before you omit n, the calculator automatically uses n = 1.
• Make sure that the value used as the final term B is greater than the value used as constants, and the value currently...
User Guide - Page 67
... occurs.
• You can be used as constants, and the value currently assigned to 9))
Example
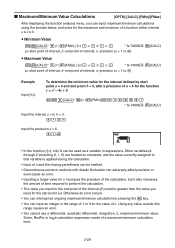
Input f (x). I Maximum/Minimum Value Calculations
[OPTN]-[CALC]-[FMin]/[FMax]
After displaying the function analysis menu, you input for the value of a function within interval
a x b.
S Minimum Value
*(CALC)* (E)(FMin) f (x)
a
b
n
* fx-7400GII: (CALC)
(a: start point of...
User Guide - Page 71
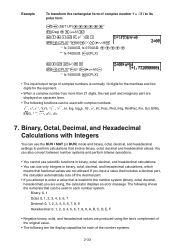
If you input a value that includes a decimal part, the calculator automatically cuts off the decimal part. • If you attempt to enter a value that can use the RUN • MAT (or RUN) mode and binary, octal, decimal, and hexadecimal settings to its
polar form
K(SET UP)AAAAAA*
(Deg)A(a+bi))
@
V()B
*(CPLX)**(i)(E)(rQ)U * fx-7400GII, fx-9750GII: AAAAA ** fx-7400GII: (CPLX...
User Guide - Page 101
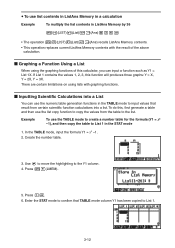
... formula (Y1 = x2
-1), and then copy the table to List 1.
3-12 I Graphing a Function Using a List
When using lists with the result of this function will produces three graphs: Y = X, Y = 2X, Y = 3X. If List 1 contains the values 1, 2, 3, this calculator, you can use list contents in ListAns Memory in a calculation
Example
To multiply the list contents in the STAT mode
1. S To...
User Guide - Page 107
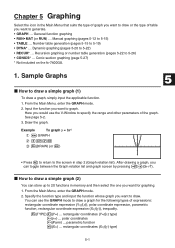
... ... Input the function you would use the GRAPH mode to draw a graph for graphing. 1. I How to draw a simple graph (1)
To draw a graph, simply input the applicable function. 1. From the Main Menu, enter the GRAPH mode. 2. You can store up to 20 functions in step 2 (Graph relation list). Sample Graphs
5
I How to draw a simple graph (2)
You can use the V-Window to specify...
User Guide - Page 108
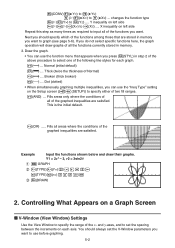
... you want to (Yb) .... Draw the graph. • You can use the "Ineq Type" setting on the Setup screen (K(SETUP)) to graph (see page 5-6). Example
Input the functions shown below and draw their graphs. and y-axes, and to select one of the following line styles for each axis. Next you should always set the spacing...
User Guide - Page 120
... displayed, to paste the
previously copied function Y=X from the clipboard Use the following cannot be used for the variable name: X, Y, r, Q, T. • You cannot assign a variable to the variable inside the function. • When Simul Graph is turned on, all of the graphs for the specified variable values are two types of functions you want to...
User Guide - Page 126
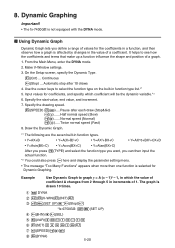
... of 1. Specify the drawing speed. (SPEED) ( ).... It helps to select the function type on the built-in the value of a coefficient. Input values for Dynamic Graphing. Example
Use Dynamic Graph to graph y = A (x - 1)2 - 1, in increments of a graph.
1. 8. Dynamic Graphing
Important! • The fx-7400Gɉ is drawn 10 times.
K DYNA
(V-WIN)(INIT))
K(SET UP)A*(Stop...
User Guide - Page 127

....
K DYNA (V-WIN)(INIT)) K(SET UP)_ AA*(On))_
*fx-9750Gɉ: A
(B-IN)(SEL) (VAR)@U?U (SET)@UCU@U) (SPEED)( )) (DYNA)
5-21 Use the cursor keys to graph y = Ax, in function type list. 5. Specify the start value, end value, and increment. 7. From the Main Menu, enter the DYNA mode. 2. Example
Use Dynamic Graph to select the function type on the Setup...
User Guide - Page 128
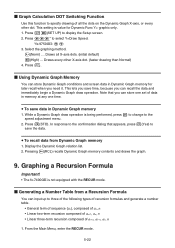
...Graph memory contents and draws the graph.
9. Graphing a Recursion Formula
Important! • The fx-7400Gɉ is value for later recall when you can store Dynamic Graph conditions and screen data in Dynamic Graph... Graph memory
1. I Graph Calculation DOT Switching Function
Use this function to specify drawing of all X-axis dots. (initial default) (High) ... Display the Dynamic Graph ...
User Guide - Page 129

... = 1, as n changes in
value from 1 to draw a line graph. Specify a start point value if you can graph the values on a line graph or plot type graph. 1. I Graphing a Recursion Formula
After generating a number... 65, Yscale = 5
5-23 Display the recursion formula number table. 7. Use the table values to 6. Input the recursion formula.
4.
Specify the recursion formula type and input ...
User Guide - Page 137
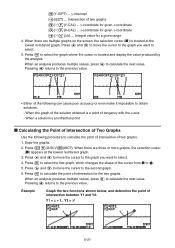
... selection cursor (I) is an inflection point
I Calculating the Point of Intersection of Two Graphs
Use the following can cause poor accuracy or even make it impossible to R.
5.
y-intercept
(ISCT) ... Press U to select the first graph, which changes the shape of tangency with the x-axis
- Press U to select the graph where the cursor is a point of the...
User Guide - Page 142
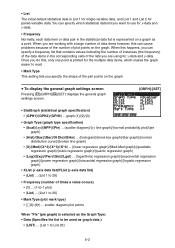
... regression graph}/{Med-Med graph}/{quadratic
regression graph}/{cubic regression graph}/{quartic regression graph} • {Log}/{Exp}/{Pwr}/{Sin}/{Lgst} ... {logarithmic regression graph}/{exponential regression
graph}/{power regression graph}/{sinusoidal regression graph}/{logistic regression graph}
• XList (x-axis data list)/YList (y-axis data list)
• {List} ... {List 1 to use for...
User Guide - Page 160
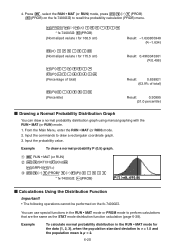
... EBCU (Percentage of total)
Result:
0.30995
(31.0 percentile)
I Calculations Using the Distribution Function
Important! • The following operations cannot be performed on the fx-7400GII) to draw a rectangular coordinate graph. 3. Input the probability value. You can draw a normal probability distribution graph using manual graphing with the RUN • MAT (or RUN) mode. 1.
Similar Questions

Where Is The Absolute Value Button On The Casio Fx-9750gii
(Posted by cubalDougla 9 years ago)

How To Calculate Standard Deviation Using Casio Fx-9750gii
(Posted by Jebcc214 9 years ago)

Instructions On How To Use Casio Fx-9750gii
(Posted by Bajdelul 10 years ago)

Tell Me How Get The P-value Using A Fx-9750gii
(Posted by mamih 10 years ago)
