User Guide
Page 2
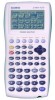
... {DEL} ... {function delete} • {TYPE} ... {graph type menu} • {COLR} ... {graph color} CFX • {GMEM} ... {graph memory save/recall} • {DRAW} ... {graph draw} indicates {COLR} is not supported by the fx-9750G PLUS. This manual covers the operations of the following symbols ...when using this mark next to it. 8-1 Before Trying to draw their graphs. When you do, the Graph Function menu appears on the display. CFX CASIO ELECTRONICS CO., LTD. Note the meaning of various different calculator...
... {DEL} ... {function delete} • {TYPE} ... {graph type menu} • {COLR} ... {graph color} CFX • {GMEM} ... {graph memory save/recall} • {DRAW} ... {graph draw} indicates {COLR} is not supported by the fx-9750G PLUS. This manual covers the operations of the following symbols ...when using this mark next to it. 8-1 Before Trying to draw their graphs. When you do, the Graph Function menu appears on the display. CFX CASIO ELECTRONICS CO., LTD. Note the meaning of various different calculator...
User Guide
Page 6
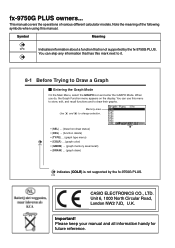
....) svwf (Stores the expression.) 45 4 2. (COLR) 23456 • Press the function key that corresponds to the color you draw a graph or run a program, any comment text normally appears on the same screen, making each one distinct and easy to view. Example: To draw... a sine curve 1. • Statistical Regression Graph Example CFX • When you want to use for the graph: 1 2 3 for blue, for orange, for green. 2 3. (Orng) (Specifies the graph color.) J 6 6 4. (DRAW) (Draws the graph) You can , however, change the color of different color on...
....) svwf (Stores the expression.) 45 4 2. (COLR) 23456 • Press the function key that corresponds to the color you draw a graph or run a program, any comment text normally appears on the same screen, making each one distinct and easy to view. Example: To draw... a sine curve 1. • Statistical Regression Graph Example CFX • When you want to use for the graph: 1 2 3 for blue, for orange, for green. 2 3. (Orng) (Specifies the graph color.) J 6 6 4. (DRAW) (Draws the graph) You can , however, change the color of different color on...
User Guide
Page 9
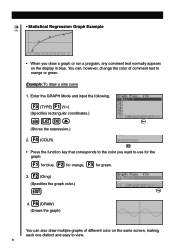
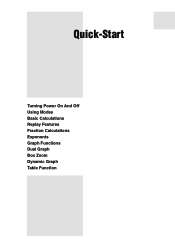
Quick-Start Turning Power On And Off Using Modes Basic Calculations Replay Features Fraction Calculations Exponents Graph Functions Dual Graph Box Zoom Dynamic Graph Table Function
Quick-Start Turning Power On And Off Using Modes Basic Calculations Replay Features Fraction Calculations Exponents Graph Functions Dual Graph Box Zoom Dynamic Graph Table Function
User Guide
Page 10
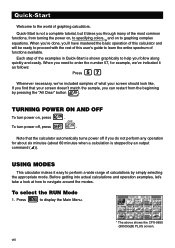
...Press to navigate around the modes. Quick-Start is shown graphically to help you 'll have mastered the basic operation of this calculator and will be ready to proceed with the rest of this user's guide to learn the entire spectrum of the examples in Quick... on, to specifying colors, and on , press . Quick-Start Welcome to the world of calculations by simply selecting the appropriate mode. viii USING MODES This calculator makes it easy to perform a wide range of graphing calculators. Before getting into actual calculations and operation examples, let's take a look like.
...Press to navigate around the modes. Quick-Start is shown graphically to help you 'll have mastered the basic operation of this calculator and will be ready to proceed with the rest of this user's guide to learn the entire spectrum of the examples in Quick... on, to specifying colors, and on , press . Quick-Start Welcome to the world of calculations by simply selecting the appropriate mode. viii USING MODES This calculator makes it easy to perform a wide range of graphing calculators. Before getting into actual calculations and operation examples, let's take a look like.

User Guide
Page 15
d e f c 2. Example 1: To graph Y = X(X + 1)(X - 2) m 1. Press (DRAW) or to highlight GRAPH, w and then press . 3. Press . Press (G-Solv). 1 xiii Quick-Start GRAPH FUNCTIONS The graphing capabilities of Y = X(X + 1)(X - 2) ! 5 1. v (v+b) (v -c)w 6 w 4. Use , , , and to draw the graph. vertical axis: y) or polar coordinates (angle: θ ; Input the formula. Example 2: To determine the roots of this calculator makes it possible to draw complex graphs using either rectangular coordinates (horizontal axis: x ; distance from origin: r).
d e f c 2. Example 1: To graph Y = X(X + 1)(X - 2) m 1. Press (DRAW) or to highlight GRAPH, w and then press . 3. Press . Press (G-Solv). 1 xiii Quick-Start GRAPH FUNCTIONS The graphing capabilities of Y = X(X + 1)(X - 2) ! 5 1. v (v+b) (v -c)w 6 w 4. Use , , , and to draw the graph. vertical axis: y) or polar coordinates (angle: θ ; Input the formula. Example 2: To determine the roots of this calculator makes it possible to draw complex graphs using either rectangular coordinates (horizontal axis: x ; distance from origin: r).
User Guide
Page 17
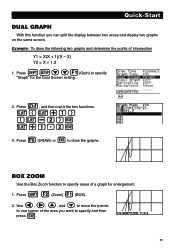
Press , and then input the two functions. xv v(v+b) (v-c)w v+b.cw 6 w 3. Press (DRAW) or to draw the graphs. 123456 BOX ZOOM Use the Box Zoom function to specify areas of a graph for the Dual Screen setting. Press (Zoom) (BOX). Use , , , and to move the pointer to one corner of intersection Y1... = X(X + 1)(X - 2) Y2 = X + 1.2 1. J 2. d e f c 2. Press !Zcc1(Grph) to specify "Graph" for enlargement. ! 2 1 1. Example: To draw the following two graphs and determine the points of the area you can split the display between two areas and display two...
Press , and then input the two functions. xv v(v+b) (v-c)w v+b.cw 6 w 3. Press (DRAW) or to draw the graphs. 123456 BOX ZOOM Use the Box Zoom function to specify areas of a graph for the Dual Screen setting. Press (Zoom) (BOX). Use , , , and to move the pointer to one corner of intersection Y1... = X(X + 1)(X - 2) Y2 = X + 1.2 1. J 2. d e f c 2. Press !Zcc1(Grph) to specify "Graph" for enlargement. ! 2 1 1. Example: To draw the following two graphs and determine the points of the area you can split the display between two areas and display two...
User Guide
Page 18
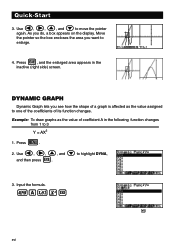
Example: To draw graphs as the value assigned to one of the coefficients of coefficient A in the inactive (right side) screen. Press . d e f c 2. w 4. Use , , , and to highlight DYNA, w and then ... enlarge. aAvxw xvi 4 12356 Move the pointer so the box encloses the area you do, a box appears on the display. Input the formula. DYNAMIC GRAPH Dynamic Graph lets you see how the shape of a graph is affected as the value of its function changes. Quick-Start d e f c 3. Use , , , and to move the pointer again.
Example: To draw graphs as the value assigned to one of the coefficients of coefficient A in the inactive (right side) screen. Press . d e f c 2. w 4. Use , , , and to highlight DYNA, w and then ... enlarge. aAvxw xvi 4 12356 Move the pointer so the box encloses the area you do, a box appears on the display. Input the formula. DYNAMIC GRAPH Dynamic Graph lets you see how the shape of a graph is affected as the value of its function changes. Quick-Start d e f c 3. Use , , , and to move the pointer again.
User Guide
Page 19
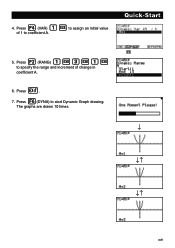
The graphs are drawn 10 times. 23456 ↓ ↓↑ ↓↑ xvii J 6. Press . 6 7. Quick-Start 1 5. Press (DYNA) to coefficient A. Press (VAR) to assign an initial value of change in coefficient A. 4 bw 4. Press 2 (RANG) bwdwbw to specify the range and increment of 1 to start Dynamic Graph drawing.
The graphs are drawn 10 times. 23456 ↓ ↓↑ ↓↑ xvii J 6. Press . 6 7. Quick-Start 1 5. Press (DYNA) to coefficient A. Press (VAR) to assign an initial value of change in coefficient A. 4 bw 4. Press 2 (RANG) bwdwbw to specify the range and increment of 1 to start Dynamic Graph drawing.
User Guide
Page 25
... 104 Solve Calculations 107 What to Do When an Error Occurs 110 Chapter 8 8-1 8-2 8-3 8-4 8-5 8-6 8-7 8-8 Graphing 111 Before Trying to Draw a Graph 112 View Window (V-Window) Settings 113 Graph Function Operations 117 Graph Memory 122 Drawing Graphs Manually 123 Other Graphing Functions 128 Picture Memory 139 Graph Background 140 Chapter 9 Graph Solve 143 9-1 Before Using Graph Solve 144 9-2 Analyzing a Function Graph 145 Chapter...
... 104 Solve Calculations 107 What to Do When an Error Occurs 110 Chapter 8 8-1 8-2 8-3 8-4 8-5 8-6 8-7 8-8 Graphing 111 Before Trying to Draw a Graph 112 View Window (V-Window) Settings 113 Graph Function Operations 117 Graph Memory 122 Drawing Graphs Manually 123 Other Graphing Functions 128 Picture Memory 139 Graph Background 140 Chapter 9 Graph Solve 143 9-1 Before Using Graph Solve 144 9-2 Analyzing a Function Graph 145 Chapter...
User Guide
Page 26
... 244 17-5 Switching Between List Files 248 Chapter 18 Statistical Graphs and Calculations 249 18-1 Before Performing Statistical Calculations 250 18-2 Paired-Variable Statistical Calculation Examples 251 18-3 Calculating and Graphing Single-Variable Statistical Data 257 18-4 Calculating and Graphing Paired-Variable Statistical Data 261 18-5 Performing Statistical Calculations 270 18-6 Tests ...276 18-7 Confidence Interval 294 18-8 Distribution...
... 244 17-5 Switching Between List Files 248 Chapter 18 Statistical Graphs and Calculations 249 18-1 Before Performing Statistical Calculations 250 18-2 Paired-Variable Statistical Calculation Examples 251 18-3 Calculating and Graphing Single-Variable Statistical Data 257 18-4 Calculating and Graphing Paired-Variable Statistical Data 261 18-5 Performing Statistical Calculations 270 18-6 Tests ...276 18-7 Confidence Interval 294 18-8 Distribution...


