User Guide
Page 2
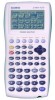
... Menu, select the GRAPH icon and enter the GRAPH Mode. When you do, the Graph Function menu appears on the display. Unit 6, 1000 North Circular Road, London NW2 7JD, U.K. This manual covers the operations of the following symbols when using this menu to store, edit, and recall functions and to change selection. • {SEL} ... {draw/non-draw status} • {DEL} ... {function delete} • {TYPE} ... {graph type menu} • {COLR} ... {graph color} CFX • {GMEM} ... {graph memory...
... Menu, select the GRAPH icon and enter the GRAPH Mode. When you do, the Graph Function menu appears on the display. Unit 6, 1000 North Circular Road, London NW2 7JD, U.K. This manual covers the operations of the following symbols when using this menu to store, edit, and recall functions and to change selection. • {SEL} ... {draw/non-draw status} • {DEL} ... {function delete} • {TYPE} ... {graph type menu} • {COLR} ... {graph color} CFX • {GMEM} ... {graph memory...

User Guide
Page 3
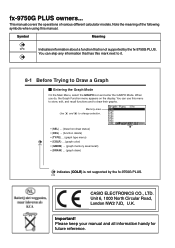
... correctly. Remove the insulating sheet at the point marked 1. 1 2. Remove the back cover from the calculator by the arrow. BACK UP 4. The calculator should automatically turn the calculator over. Be sure to perform the following procedure to load batteries, reset the calculator, and adjust the contrast before trying to the calculator and then turn on power and perform the memory reset operation. 2 i BEFORE USING THE CALCULATOR FOR THE FIRST TIME... BACK...
... correctly. Remove the insulating sheet at the point marked 1. 1 2. Remove the back cover from the calculator by the arrow. BACK UP 4. The calculator should automatically turn the calculator over. Be sure to perform the following procedure to load batteries, reset the calculator, and adjust the contrast before trying to the calculator and then turn on power and perform the memory reset operation. 2 i BEFORE USING THE CALCULATOR FOR THE FIRST TIME... BACK...
User Guide
Page 4
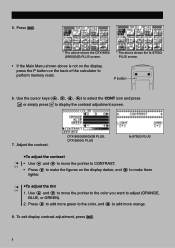
... of the calculator to make them lighter. Adjust the contrast. Press e to add more green to the color, and d to display the contrast adjustment screen. 7. To exit display contrast adjustment, press m. 5. Use the cursor keys (f, c, d, e) to select the CONT icon and press E w or simply pressc to add more orange. 8. Press m. * The above shows the CFX-9850 (9950)G(B) PLUS screen. * The above shows the fx-9750G PLUS screen. •...
... of the calculator to make them lighter. Adjust the contrast. Press e to add more green to the color, and d to display the contrast adjustment screen. 7. To exit display contrast adjustment, press m. 5. Use the cursor keys (f, c, d, e) to select the CONT icon and press E w or simply pressc to add more orange. 8. Press m. * The above shows the CFX-9850 (9950)G(B) PLUS screen. * The above shows the fx-9750G PLUS screen. •...
User Guide
Page 6
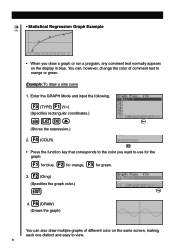
..., change the color of different color on the display in blue. iv Example: To draw a sine curve 1. You can also draw multiple graphs of comment text to view. Enter the GRAPH Mode and input the following. 3(TYPE)1(Y=) (Specifies rectangular coordinates.) svwf (Stores the expression.) 45 4 2. (COLR) 23456 • Press the function key that corresponds to the color you draw a graph or run a program, any comment text normally appears on the same screen, making...
..., change the color of different color on the display in blue. iv Example: To draw a sine curve 1. You can also draw multiple graphs of comment text to view. Enter the GRAPH Mode and input the following. 3(TYPE)1(Y=) (Specifies rectangular coordinates.) svwf (Stores the expression.) 45 4 2. (COLR) 23456 • Press the function key that corresponds to the color you draw a graph or run a program, any comment text normally appears on the same screen, making...
User Guide
Page 9
Quick-Start Turning Power On And Off Using Modes Basic Calculations Replay Features Fraction Calculations Exponents Graph Functions Dual Graph Box Zoom Dynamic Graph Table Function
Quick-Start Turning Power On And Off Using Modes Basic Calculations Replay Features Fraction Calculations Exponents Graph Functions Dual Graph Box Zoom Dynamic Graph Table Function
User Guide
Page 10
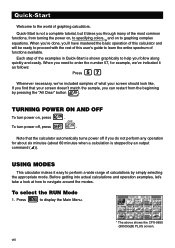
... Mode m 1. Each step of the most common functions, from the beginning o by an output command (^)). Press to display the Main Menu. * The above shows the CFX-9850 (9950)G(B) PLUS screen. o To turn power on to graphing complex equations. TURNING POWER ON AND OFF o To turn power off if you through many of the examples in Quick-Start is stopped by pressing the "All Clear" button . Quick-Start is not a complete tutorial...
... Mode m 1. Each step of the most common functions, from the beginning o by an output command (^)). Press to display the Main Menu. * The above shows the CFX-9850 (9950)G(B) PLUS screen. o To turn power on to graphing complex equations. TURNING POWER ON AND OFF o To turn power off if you through many of the examples in Quick-Start is stopped by pressing the "All Clear" button . Quick-Start is not a complete tutorial...
User Guide
Page 11
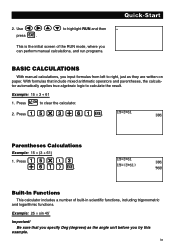
... is the initial screen of built-in scientific functions, including trigonometric and logarithmic functions. ix Example: 15 × 3 + 61 o 1. Built-In Functions This calculator includes a number of the RUN mode, where you can perform manual calculations, and run programs. Quick-Start BASIC CALCULATIONS With manual calculations, you specify Deg (degrees) as they are written on paper. With formulas that you input formulas from left to calculate the result. Use to clear the calculator. 2. Press to...
... is the initial screen of built-in scientific functions, including trigonometric and logarithmic functions. ix Example: 15 × 3 + 61 o 1. Built-In Functions This calculator includes a number of the RUN mode, where you can perform manual calculations, and run programs. Quick-Start BASIC CALCULATIONS With manual calculations, you specify Deg (degrees) as they are written on paper. With formulas that you input formulas from left to calculate the result. Use to clear the calculator. 2. Press to...
User Guide
Page 12
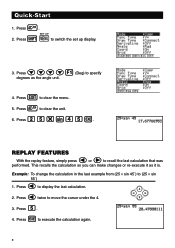
... . Quick-Start o 1. REPLAY FEATURES d e With the replay feature, simply press or to display the last calculation. Press to switch the set up display. 3. f 3. w 4. Press to execute the calculation again. o 5. d 2. x Press twice to clear the menu. Press to move the cursor under the 4. This recalls the calculation so you can make changes or re-execute it is. Press cccc1 (Deg) to specify degrees as...
... . Quick-Start o 1. REPLAY FEATURES d e With the replay feature, simply press or to display the last calculation. Press to switch the set up display. 3. f 3. w 4. Press to execute the calculation again. o 5. d 2. x Press twice to clear the menu. Press to move the cursor under the 4. This recalls the calculation so you can make changes or re-execute it is. Press cccc1 (Deg) to specify degrees as...

User Guide
Page 13
... to convert back to input fractions into calculations. xi Quick-Start FRACTION CALCULATIONS $ You can use the key to a mixed fraction. Converting a Fraction to Its Decimal Equivalent M While a fraction is shown on the display, press to convert it to an improper fraction. Press b$bf $ bg+dh$ jw. Indicates 6 7/144 Converting a Mixed Fraction to an Improper Fraction d/c ! $ While a mixed fraction is used to a fraction. M Press again to convert back to separate the various parts of a fraction. Example...
... to convert back to input fractions into calculations. xi Quick-Start FRACTION CALCULATIONS $ You can use the key to a mixed fraction. Converting a Fraction to Its Decimal Equivalent M While a fraction is shown on the display, press to convert it to an improper fraction. Press b$bf $ bg+dh$ jw. Indicates 6 7/144 Converting a Mixed Fraction to an Improper Fraction d/c ! $ While a mixed fraction is used to a fraction. M Press again to convert back to separate the various parts of a fraction. Example...

User Guide
Page 15
Press . v (v+b) (v -c)w 6 w 4. Example 1: To graph Y = X(X + 1)(X - 2) m 1. Press (DRAW) or to highlight GRAPH, w and then press . 3. Press (G-Solv). 1 xiii Input the formula. vertical axis: y) or polar coordinates (angle: θ ; distance from origin: r). Use , , , and to draw the graph. Quick-Start GRAPH FUNCTIONS The graphing capabilities of Y = X(X + 1)(X - 2) ! 5 1. d e f c 2. Example 2: To determine the roots of this calculator makes it possible to draw complex graphs using either rectangular coordinates (horizontal axis: x ;
Press . v (v+b) (v -c)w 6 w 4. Example 1: To graph Y = X(X + 1)(X - 2) m 1. Press (DRAW) or to highlight GRAPH, w and then press . 3. Press (G-Solv). 1 xiii Input the formula. vertical axis: y) or polar coordinates (angle: θ ; distance from origin: r). Use , , , and to draw the graph. Quick-Start GRAPH FUNCTIONS The graphing capabilities of Y = X(X + 1)(X - 2) ! 5 1. d e f c 2. Example 2: To determine the roots of this calculator makes it possible to draw complex graphs using either rectangular coordinates (horizontal axis: x ;

User Guide
Page 16
Next, use to move the pointer to input the integration range, which becomes shaded on the display. Press (ROOT). Press (g). 123456 3 3. Example 3: Determine the area bounded by the origin and the X = -1 root obtained for other roots. Press (G-Solv). 6 2. xiv e Press for Y = X(X + 1)(X - 2) !5 1. Use to move the pointer to the location where X = 0, and w then press to the location where w e X = -1, and then press . Press (∫dx). 123456 d 4. Quick-Start 1 2.
Next, use to move the pointer to input the integration range, which becomes shaded on the display. Press (ROOT). Press (g). 123456 3 3. Example 3: Determine the area bounded by the origin and the X = -1 root obtained for other roots. Press (G-Solv). 6 2. xiv e Press for Y = X(X + 1)(X - 2) !5 1. Use to move the pointer to the location where X = 0, and w then press to the location where w e X = -1, and then press . Press (∫dx). 123456 d 4. Quick-Start 1 2.
User Guide
Page 17
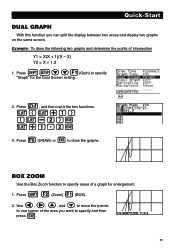
... two areas and display two graphs on the same screen. d e f c 2. Use , , , and to move the pointer to one corner of a graph for the Dual Screen setting. xv Example: To draw the following two graphs and determine the points of intersection Y1 = X(X + 1)(X - 2) Y2 = X + 1.2 1. Press (Zoom) (BOX). Press , and then input the two functions. J 2. v(v+b) (v-c)w v+b.cw 6 w 3. Quick-Start DUAL GRAPH With this function you want to specify...
... two areas and display two graphs on the same screen. d e f c 2. Use , , , and to move the pointer to one corner of a graph for the Dual Screen setting. xv Example: To draw the following two graphs and determine the points of intersection Y1 = X(X + 1)(X - 2) Y2 = X + 1.2 1. Press (Zoom) (BOX). Press , and then input the two functions. J 2. v(v+b) (v-c)w v+b.cw 6 w 3. Quick-Start DUAL GRAPH With this function you want to specify...
User Guide
Page 18
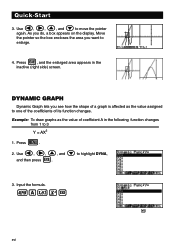
... side) screen. DYNAMIC GRAPH Dynamic Graph lets you do, a box appears on the display. aAvxw xvi 4 12356 w 4. Press . Use , , , and to 3 Y = AX2 m 1. Press , and the enlarged area appears in the following function changes from 1 to highlight DYNA, w and then press . 3. Example: To draw graphs as the value assigned to enlarge. d e f c 2. Use , , , and to move the pointer again. Input the formula. As you...
... side) screen. DYNAMIC GRAPH Dynamic Graph lets you do, a box appears on the display. aAvxw xvi 4 12356 w 4. Press . Use , , , and to 3 Y = AX2 m 1. Press , and the enlarged area appears in the following function changes from 1 to highlight DYNA, w and then press . 3. Example: To draw graphs as the value assigned to enlarge. d e f c 2. Use , , , and to move the pointer again. Input the formula. As you...
User Guide
Page 20
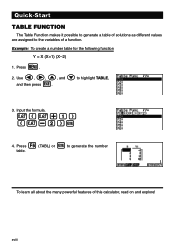
Quick-Start TABLE FUNCTION The Table Function makes it possible to generate a table of solutions as different values are assigned to the variables of this calculator, read on and explore! Press (TABL) or to highlight TABLE, w and then press . 3. d e f c 2. Input the formula. Use , , , and to generate the number table. v(v+b) (v-c)w 6 w 4. To learn all about the many powerful features of a function. Press . Example: To create a number table for the following function Y = X (X+1) (X-2) m 1. xviii
Quick-Start TABLE FUNCTION The Table Function makes it possible to generate a table of solutions as different values are assigned to the variables of this calculator, read on and explore! Press (TABL) or to highlight TABLE, w and then press . 3. d e f c 2. Input the formula. Use , , , and to generate the number table. v(v+b) (v-c)w 6 w 4. To learn all about the many powerful features of a function. Press . Example: To create a number table for the following function Y = X (X+1) (X-2) m 1. xviii
User Guide
Page 21
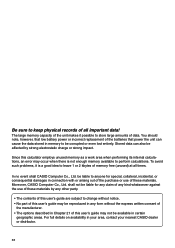
... no event will not operate during calculations. When exposed to low temperatures, the calculator may require more time to display results and may stop or can damage the calculator's memory contents. • Using the calculator near a television or radio can cause interference with a cloth that the power switch is set to OFF when replacing batteries. • If the calculator is used during program execution can leak and...
... no event will not operate during calculations. When exposed to low temperatures, the calculator may require more time to display results and may stop or can damage the calculator's memory contents. • Using the calculator near a television or radio can cause interference with a cloth that the power switch is set to OFF when replacing batteries. • If the calculator is used during program execution can leak and...
User Guide
Page 22
... this user's guide are subject to change without notice. • No part of this user's guide may be reproduced in any kind whatsoever against the use of the manufacturer. • The options described in memory to be available in certain geographic areas. In no event shall CASIO Computer Co., Ltd. Moreover, CASIO Computer Co., Ltd. To avoid such problems, it possible to perform calculations...
... this user's guide are subject to change without notice. • No part of this user's guide may be reproduced in any kind whatsoever against the use of the manufacturer. • The options described in memory to be available in certain geographic areas. In no event shall CASIO Computer Co., Ltd. Moreover, CASIO Computer Co., Ltd. To avoid such problems, it possible to perform calculations...
User Guide
Page 24
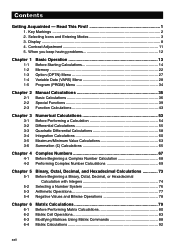
... Adjustment 11 5. Key Markings ...2 2. Selecting Icons and Entering Modes 3 3. Display ...8 4. When you keep having problems 12 Chapter 1 1-1 1-2 1-3 1-4 1-5 Basic Operation 13 Before Starting Calculations 14 Memory ...22 Option (OPTN) Menu 27 Variable Data (VARS) Menu 28 Program (PRGM) Menu 34 Chapter 2 2-1 2-2 2-3 Manual Calculations 35 Basic Calculations 36 Special Functions 39 Function Calculations 43 Chapter 3 3-1 3-2 3-3 3-4 3-5 3-6 Numerical Calculations 53 Before Performing a Calculation 54 Differential Calculations 55 Quadratic Differential Calculations...
... Adjustment 11 5. Key Markings ...2 2. Selecting Icons and Entering Modes 3 3. Display ...8 4. When you keep having problems 12 Chapter 1 1-1 1-2 1-3 1-4 1-5 Basic Operation 13 Before Starting Calculations 14 Memory ...22 Option (OPTN) Menu 27 Variable Data (VARS) Menu 28 Program (PRGM) Menu 34 Chapter 2 2-1 2-2 2-3 Manual Calculations 35 Basic Calculations 36 Special Functions 39 Function Calculations 43 Chapter 3 3-1 3-2 3-3 3-4 3-5 3-6 Numerical Calculations 53 Before Performing a Calculation 54 Differential Calculations 55 Quadratic Differential Calculations...
User Guide
Page 25
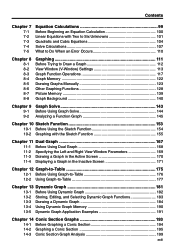
... 7-5 Equation Calculations 99 Before Beginning an Equation Calculation 100 Linear Equations with Two to Six Unknowns 101 Quadratic and Cubic Equations 104 Solve Calculations 107 What to Do When an Error Occurs 110 Chapter 8 8-1 8-2 8-3 8-4 8-5 8-6 8-7 8-8 Graphing 111 Before Trying to Draw a Graph 112 View Window (V-Window) Settings 113 Graph Function Operations 117 Graph Memory 122 Drawing Graphs Manually 123 Other Graphing Functions 128 Picture Memory 139 Graph Background 140 Chapter 9 Graph Solve 143 9-1 Before Using Graph Solve 144 9-2 Analyzing a Function Graph 145...
... 7-5 Equation Calculations 99 Before Beginning an Equation Calculation 100 Linear Equations with Two to Six Unknowns 101 Quadratic and Cubic Equations 104 Solve Calculations 107 What to Do When an Error Occurs 110 Chapter 8 8-1 8-2 8-3 8-4 8-5 8-6 8-7 8-8 Graphing 111 Before Trying to Draw a Graph 112 View Window (V-Window) Settings 113 Graph Function Operations 117 Graph Memory 122 Drawing Graphs Manually 123 Other Graphing Functions 128 Picture Memory 139 Graph Background 140 Chapter 9 Graph Solve 143 9-1 Before Using Graph Solve 144 9-2 Analyzing a Function Graph 145...
User Guide
Page 26
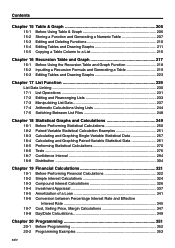
...Table and Graph Function 218 16-2 Inputting a Recursion Formula and Generating a Table 219 16-3 Editing Tables and Drawing Graphs 223 Chapter 17 List Function 229 List Data Linking 230 17-1 List Operations 231 17-2 Editing and Rearranging Lists 233 17-3 Manipulating List Data 237 17-4 Arithmetic Calculations Using Lists 244 17-5 Switching Between List Files 248 Chapter 18 Statistical Graphs and Calculations 249 18-1 Before Performing Statistical Calculations 250 18-2 Paired-Variable Statistical Calculation Examples 251 18-3 Calculating and Graphing Single-Variable Statistical Data...
...Table and Graph Function 218 16-2 Inputting a Recursion Formula and Generating a Table 219 16-3 Editing Tables and Drawing Graphs 223 Chapter 17 List Function 229 List Data Linking 230 17-1 List Operations 231 17-2 Editing and Rearranging Lists 233 17-3 Manipulating List Data 237 17-4 Arithmetic Calculations Using Lists 244 17-5 Switching Between List Files 248 Chapter 18 Statistical Graphs and Calculations 249 18-1 Before Performing Statistical Calculations 250 18-2 Paired-Variable Statistical Calculation Examples 251 18-3 Calculating and Graphing Single-Variable Statistical Data...
User Guide
Page 27
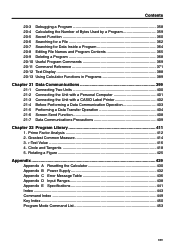
... A Resetting the Calculator 430 Appendix B Power Supply 432 Appendix C Error Message Table 436 Appendix D Input Ranges 438 Appendix E Specifications 441 Index ...443 Command Index 449 Key Index ...450 Program Mode Command List 453 xxv Greatest Common Measure 414 3. Circle and Tangents 418 5. t-Test Value ...416 4. Prime Factor Analysis 412 2. Contents 20-3 Debugging a Program 358 20-4 Calculating the Number of Bytes Used by a Program 359 20-5 Secret Function 360...
... A Resetting the Calculator 430 Appendix B Power Supply 432 Appendix C Error Message Table 436 Appendix D Input Ranges 438 Appendix E Specifications 441 Index ...443 Command Index 449 Key Index ...450 Program Mode Command List 453 xxv Greatest Common Measure 414 3. Circle and Tangents 418 5. t-Test Value ...416 4. Prime Factor Analysis 412 2. Contents 20-3 Debugging a Program 358 20-4 Calculating the Number of Bytes Used by a Program 359 20-5 Secret Function 360...


