User Guide
Page 49
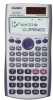
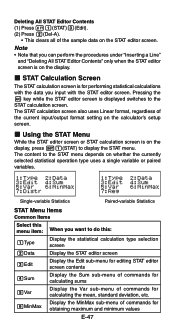
... Display the Edit sub-menu for editing STAT editor screen contents Display the Sum sub-menu of commands for calculating sums Display the Var sub-menu of commands for calculating the mean, standard deviation, etc. Note • Note that you want to the STAT menu depends on the display. k Using... the STAT Menu While the STAT editor screen or STAT calculation screen is displayed switches to display the STAT menu. ...
... Display the Edit sub-menu for editing STAT editor screen contents Display the Sum sub-menu of commands for calculating sums Display the Var sub-menu of commands for calculating the mean, standard deviation, etc. Note • Note that you want to the STAT menu depends on the display. k Using... the STAT Menu While the STAT editor screen or STAT calculation screen is displayed switches to display the STAT menu. ...
User Guide
Page 50
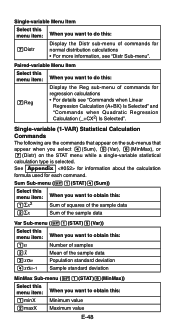
... Paired-variable Menu Item Select this menu item: When you want to do this : 7Reg Display the Reg sub-menu of commands for regression calculations • For details see "Distr Sub-menu". Single-variable Menu Item Select this menu item: When you want to do this : 7Distr ...Select this menu item: When you want to obtain this: 1n 2o 3xσn 4xσn-1 Number of samples Mean of the sample data Population standard deviation Sample standard deviation MinMax Sub-menu (11(STAT)6(MinMax)) Select this menu item: 1minX 2maxX When you select 4(Sum), 5(Var), 6(MinMax), or 7(Distr) on ...
... Paired-variable Menu Item Select this menu item: When you want to do this : 7Reg Display the Reg sub-menu of commands for regression calculations • For details see "Distr Sub-menu". Single-variable Menu Item Select this menu item: When you want to do this : 7Distr ...Select this menu item: When you want to obtain this: 1n 2o 3xσn 4xσn-1 Number of samples Mean of the sample data Population standard deviation Sample standard deviation MinMax Sub-menu (11(STAT)6(MinMax)) Select this menu item: 1minX 2maxX When you select 4(Sum), 5(Var), 6(MinMax), or 7(Distr) on ...
User Guide
Page 51
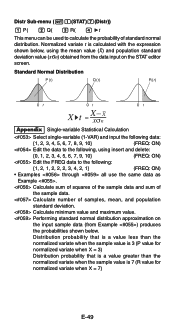
...than the normalized variate when the sample value is calculated with the expression shown below . Calculate sum of squares of the sample data and sum of samples, mean value (o) and population standard deviation value (xσn) obtained from the data input on...) and input the following data: {1, 2, 3, 4, 5, 6, 7, 8, 9, 10} (FREQ: ON) Edit the data to the following, using the mean , and population standard deviation. Calculate minimum value and maximum value. Distr Sub-menu (11(STAT)7(Distr)) 1 P( 2 Q( 3 R( 4 't This menu can be used to the following: {1, 2, 1, 2,...
...than the normalized variate when the sample value is calculated with the expression shown below . Calculate sum of squares of the sample data and sum of samples, mean value (o) and population standard deviation value (xσn) obtained from the data input on...) and input the following data: {1, 2, 3, 4, 5, 6, 7, 8, 9, 10} (FREQ: ON) Edit the data to the following, using the mean , and population standard deviation. Calculate minimum value and maximum value. Distr Sub-menu (11(STAT)7(Distr)) 1 P( 2 Q( 3 R( 4 't This menu can be used to the following: {1, 2, 1, 2,...
User Guide
Page 52
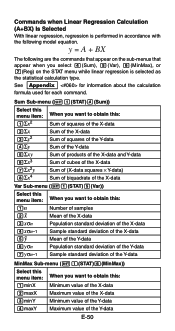
... or 7(Reg) on the STAT menu while linear regression is performed in accordance with the following model equation. See Appendix for information about the calculation formula used for each command. y = A + BX The following are the commands that appear on the sub-menus that appear when you want...Select this : 1n 2o 3xσn 4xσn-1 5p 6yσn 7yσn-1 Number of samples Mean of the X-data Population standard deviation of the X-data Sample standard deviation of the X-data Mean of the Y-data Population standard deviation of the Y-data Sample standard deviation of the Y-data E-50
... or 7(Reg) on the STAT menu while linear regression is performed in accordance with the following model equation. See Appendix for information about the calculation formula used for each command. y = A + BX The following are the commands that appear on the sub-menus that appear when you want...Select this : 1n 2o 3xσn 4xσn-1 5p 6yσn 7yσn-1 Number of samples Mean of the X-data Population standard deviation of the X-data Sample standard deviation of the X-data Mean of the Y-data Population standard deviation of the Y-data Sample standard deviation of the Y-data E-50
User Guide
Page 53
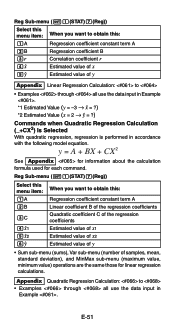
... Estimated value of x2 Estimated value of y • Sum sub-menu (sums), Var sub-menu (number of y Appendix Linear Regression Calculation: to • Examples through all use the data input in Example . *1 Estimated Value (y = -3 → m = ?) *2 Estimated Value (x =...calculations. Reg Sub-menu (11(STAT)7(Reg)) Select this menu item: 1A 2B 3C 4m1 5m2 6n When you want to obtain this : 1A Regression coefficient constant term A 2B Regression coefficient B 3r 4m 5n Correlation coefficient r Estimated value of x Estimated value of samples, mean, standard deviation...
... Estimated value of x2 Estimated value of y • Sum sub-menu (sums), Var sub-menu (number of y Appendix Linear Regression Calculation: to • Examples through all use the data input in Example . *1 Estimated Value (y = -3 → m = ?) *2 Estimated Value (x =...calculations. Reg Sub-menu (11(STAT)7(Reg)) Select this menu item: 1A 2B 3C 4m1 5m2 6n When you want to obtain this : 1A Regression coefficient constant term A 2B Regression coefficient B 3r 4m 5n Correlation coefficient r Estimated value of x Estimated value of samples, mean, standard deviation...


