Get support for Casio FX-9750GII-SC - Fx-9750gii-ih Graphing Calculator-yellow Sch

Casio FX-9750GII-SC Support Question

Casio FX-9750GII-SC Support Question

Find answers below for this question about Casio FX-9750GII-SC - Fx-9750gii-ih Graphing Calculator-yellow Sch.
Need a Casio FX-9750GII-SC manual? We have 1 online manual for this item!
Question posted by edDL on January 7th, 2014

How Do You Find The Slope Of A Function On A Casio Fx-9750gii

The person who posted this question about this Casio product did not include a detailed explanation. Please use the "Request More Information" button to the right if more details would help you to answer this question.

Current Answers

There are currently no answers that have been posted for this question.
Be the first to post an answer!

Remember that you can earn up to 1,100 points for every answer you submit. The better the quality of your answer, the better chance it has to be accepted.

Related Casio FX-9750GII-SC Manual Pages

User Guide - Page 67

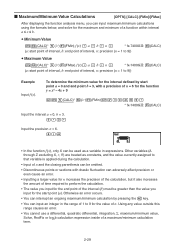
...interval, n: precision (n = 1 to that variable is applied during the calculation. • Input of n and the closing parenthesis can input maximum/minimum calculations using the formats below, and solve for the maximum and minimum of n = 6 for the function y = x2 - 4x + 9 *(CALC)* (E)(FMin)TV CT H * fx-7400GII: (CALC) Input the interval a = 0, b = 3. ? S Minimum Value *(CALC)* (E)(FMin...
User Guide - Page 101

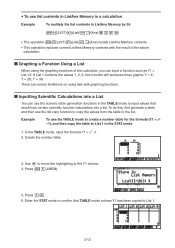
... values that TABLE mode column Y1 has been copied to the list. Create the number table. 3. I Graphing a Function Using a List When using lists with the result of this calculator, you can use the numeric table generation functions in the TABLE mode to List 1 in ListAns Memory by 36 *(LIST)(List) (Ans) BEU • The...
User Guide - Page 111

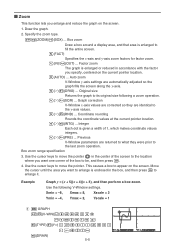
... enclosed in accordance with the factor you enlarge and reduce the graph on the screen. 1. Coordinate rounding Rounds the coordinate values at the current pointer location. (E)(INTG) ... This causes a box to its original size following V-Window settings. I Zoom This function lets you specify, centered on the current pointer location. (AUTO) ... Auto zoom...
User Guide - Page 117

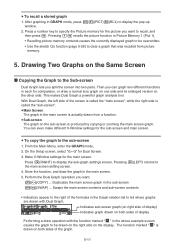
..., and then press U. S To recall a stored graph 1. This makes Dual Graph a powerful graph analysis tool. You can graph two different functions in Picture Memory 1 (Pict 1). • Recalling picture memory contents causes the currently displayed graph to the right of display Performing a draw operation with Dual Graph. Duplicates the main screen graph in the main screen. 5. Press a number...
User Guide - Page 128

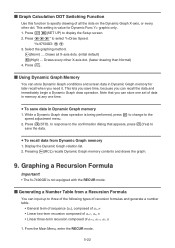
.... 1. In response to the confirmation dialog that you can store one time. Pressing (RCL) recalls Dynamic Graph memory contents and draws the graph. 9. I Graph Calculation DOT Switching Function Use this function to save the data. Graphing a Recursion Formula Important! • The fx-7400Gɉ is not equipped with the RECUR mode. Note that appears, press (Yes) to specify...
User Guide - Page 133

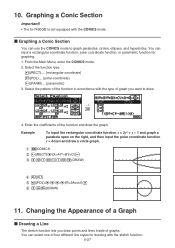
...From the Main Menu, enter the CONICS mode. 2. Graphing a Conic Section Important! • The fx-7400Gɉ is not equipped with the sketch function. 5-27 You can input a rectangular coordinate function, polar coordinate function, or parametric function for drawing with the CONICS mode. Select the function type. (RECT).... {rectangular coordinate} (POL).... {polar coordinate} (PARM...
User Guide - Page 135

... area or when an error of no value occurs. • You can draw a tangent line in the center of the graph.*1 4. Draw the graph. 3. When there are displayed for each function type.  (TYPE)(Y=)TT AT_ AU  (DRAW)  (SKTCH)(Tang)  C~CU*1 *1 You can turn off display of the coordinates at the pointer location by pressing T to...
User Guide - Page 158

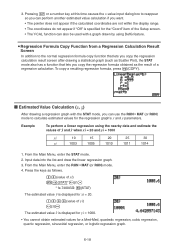
... copy function that lets you copy the regression calculation result screen after drawing a statistical graph (such as Scatter Plot), the STAT mode also has a function that ... cannot obtain estimated values for the regression graph's x and y parameters. Press the keys as the result of a regression calculation. A?(value of xi) *(STAT)*(ţ)U * fx-7400GII: (STAT) The estimated value &#...
User Guide - Page 198

... value in the reverse direction. Compound Interest This calculator uses the following function menus to maneuver between calculation result screens. • {REPT} ... {parameter input screen} • {GRPH} ... {draws graph} After drawing a graph, you can press (TRCE) to perform the corresponding calculation. • {SI} ... {simple interest} • {SFV} ... {simple future...
User Guide - Page 200

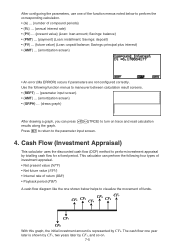
... perform investment appraisal by totalling cash flow for a fixed period. This calculator can perform the following function menus to maneuver between calculation result screens. • {REPT} ... {parameter input screen} • {AMT} ... {amortization screen} • {GRPH} ... {draws graph} After drawing a graph, you can press (TRCE) to the parameter input screen. 4. Press ) to...
User Guide - Page 201

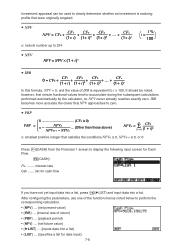
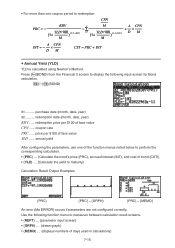
...... {inputs data into a list. It should be used to clearly determine whether an investment is equivalent to perform the corresponding calculation. • {NPV} ... {net present value} • {IRR} ... {internal rate of the function menus noted below to i × 100. S\NPV NPV = CF0 + CF1 (1+ i) + CF2 (1+ i)2 + CF3 (1+ i)3 + ... + CFn (1+ i)n n: natural number up to zero...
User Guide - Page 203

... of installment PM1} • {PRN} ... {principal portion of installment PM1} 7-8 installments per year After configuring the parameters, use one of the function menus noted below to perform the corresponding calculation. • {BAL} ... {balance of principal after conversion from the Financial 1 screen to display the following final installment P/Y ....... principal 307 ..... compoundings...
User Guide - Page 205

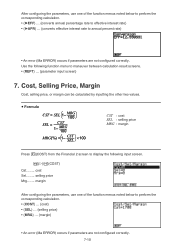
... the other two values. cost Sel......... Cost, Selling Price, Margin Cost, selling price Mrg........ After configuring the parameters, use one of the function menus noted below to perform the corresponding calculation. • {EFF} ... {converts annual percentage rate to effective interest rate} • {APR} ... {converts effective interest rate to annual percent rate} •...
User Guide - Page 206

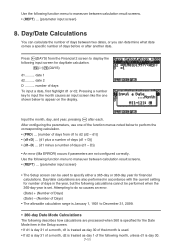
... plus a number of days (d1 + D)} • {d1-D} ... {d1 minus a number of days To input a date, first highlight d1 or d2. Use the following function menu to maneuver between calculation result screens. • {REPT} ... {parameter input screen} 8. Attempting to do so causes an error. (Date) + (Number of Days) (Date) - (Number of days before...
User Guide - Page 208

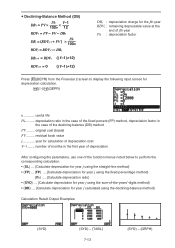
...factor in the first year of depreciation After configuring the parameters, use one of the function menus noted below to perform the corresponding calculation. • {SL} ... {Calculate depreciation for year j using the straight-line method} • {FP} ... {FP} ....{Calculate depreciation for year j using the fixed-percentage method} {I % : depreciation factor Press (DEPR) from the Financial...
User Guide - Page 210

...are not configured correctly. Press (BOND) from the Financial 2 screen to display the following function menu to maneuver between calculation result screens. • {REPT} ... {parameter input screen} • {GRPH} ... {draws graph} • {MEMO} ... {displays numbers of days used in calculations} 7-15 redemption date (month, date, year) RDV ...... s D0 &67 35&+ ,17 S Annual Yield...
User Guide - Page 228

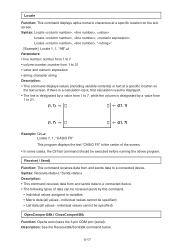
...Cls= Locate 7, 1, "CASIO FX" This program displays the text "CASIO FX" in the center of...Function: This command receives data from and sends data to a connected device. • The following types of the screen. • In some cases, the ClrText command should be received (sent) by a value from 1 to variables • Matrix data (all values - If there is a calculation input, that calculation...
User Guide - Page 233

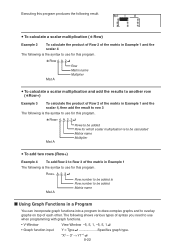
... to be calculated Matrix name Multiplier S To add two rows (Row+) Example 4 To add Row 2 to Row 3 of each other. S To calculate a scalar multiplication (>Row) Example 2 To calculate the product of Row 2 of the matrix in Example 1 The following is the syntax to use when programming with graph functions. • V-Window View Window -5, 5, 1, -5, 5, 1= • Graph function input...
User Guide - Page 381

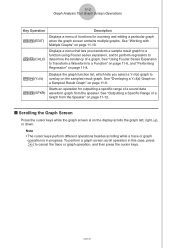
... keys perform different operations besides scrolling while a trace or graph operation is on page 11-12. To perform a graph screen scroll operation in progress. See "Working with Multiple Graphs" on page 11-9. K5(Y=fx) Displays the graph function list, which lets you transform a sample result graph to a function using Fourier series expansion, and to perform regression to overlay...
User Guide - Page 388

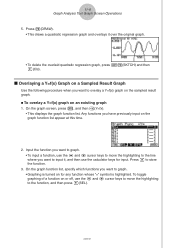
... graph 1. On the graph screen, press K, and then 5(Y=fx). • This displays the graph function list. Any functions you want to graph. • Graphing is highlighted. On the graph function list, specify which functions you want to overlay a Y=f(x) graph on for input. Input the function you want to graph. • To input a function, use the calculator keys for any function...

Similar Questions

Ask a New Question
Use the box below to post a new question about this Casio product .
Points & Prizes
  • You can earn points for nearly everything you do on HelpOwl.com
  • You can trade in those points for gift cards at leading retailers such as Amazon.com and Walmart
  • It's that simple!
See How it Works
Create a Free Account

Casio Manuals

Find free Casio FX-9750GII-SC - Fx-9750gii-ih Graphing Calculator-yellow Sch manuals and user guides available at ManualOwl.com. Try out our unique manual viewer allowing you to interact with manuals from directly within your browser!

Casio Reviews

View thousands of Casio user reviews and customer ratings available at ReviewOwl.com.

Contact Information

Complete Casio customer service contact information including steps to reach representatives, hours of operation, customer support links and more from ContactHelp.com.

Scoreboard Ratings

See detailed Casio customer service rankings, employee comments and much more from our sister site.