
Casio FX-9750GII-SC Support Question
Casio FX-9750GII-SC Support Question
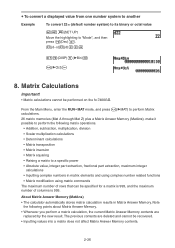
Find answers below for this question about Casio FX-9750GII-SC - Fx-9750gii-ih Graphing Calculator-yellow Sch.Need a Casio FX-9750GII-SC manual? We have 1 online manual for this item!
Question posted by mittan on December 24th, 2013
How To Perform Matrix Function On Casio Fx-9750gii
The person who posted this question about this Casio product did not include a detailed explanation. Please use the "Request More Information" button to the right if more details would help you to answer this question.
Current Answers
Related Casio FX-9750GII-SC Manual Pages
User Guide - Page 10
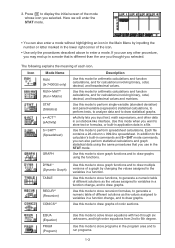
... a numeric table of different solutions as the values assigned to variables in a function. Icon
Mode Name
RUN (fx-7400Gɉ only)
RUN • MAT*1 (Run • Matrix)
Description
Use this mode to draw graphs. Use this mode for arithmetic calculations and function calculations, and for calculations involving binary, octal, decimal, and hexadecimal values and matrices.
If you...
User Guide - Page 26
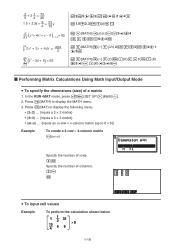
...; 6 x = 3 = 52
(MATH)(d/dx)T,3C
4
TV
T 6C3U
5
1 2x2 + 3x
+ 4dx
=
404 3
(MATH)(E)(°dx) 2TV
3T
4C1
C5U
6
∑ ( ) k2 − 3k + 5 = 55
k=2
(MATH)(E)(3)?
(K)V 3?
(K)
5C?
(K)C2C6U
I Performing Matrix Calculations Using Math Input/Output Mode
S To specify the dimensions (size) of...
User Guide - Page 51
...; The {ENG} and {ENG} menu operations are available only when there is not necessary.
* fx-7400GII, fx-9750GII: AAAAA
2-13
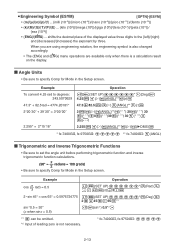
I Trigonometric and Inverse Trigonometric Functions
• Be sure to set the angle unit before performing trigonometric function and inverse trigonometric function calculations.
(90° =
2
radians = 100 grads)
• Be sure to specify Comp for Mode in...
User Guide - Page 67
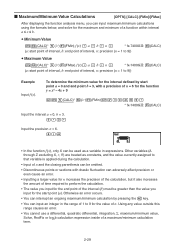
... term.
2-29 Otherwise an error occurs.
• You can interrupt an ongoing maximum/minimum calculation by start point of interval, b: end point of interval, n: precision (n = 1 to 9 for the function y = x2 - 4x + 9
*(CALC)* (E)(FMin)TV CT
H
* fx-7400GII: (CALC)
Input the interval a = 0, b = 3.
?
Other variables (A through Z excluding X, r, Ƨ) are treated as a variable in...
User Guide - Page 74
... The calculator automatically stores matrix calculation results in matrix elements and using complex number related functions • Matrix modification using matrix commands The maximum number of rows that can be specified for a matrix is 999, and the maximum number of columns is 999. From the Main Menu, enter the RUN • MAT mode, and press (MAT) to perform Matrix calculations. 26 matrix...
User Guide - Page 82
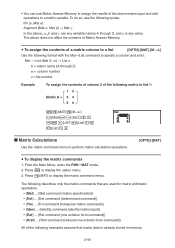
... command (reduced row echelon form command)}
All of a matrix column to a list
[OPTN]-[MAT]-[MmL]
Use the following matrix to list 1: 12
Matrix A = 3 4 56
*(MAT)(MmL) (Mat)?T(A)
A ?*(LIST)(List)@U (List)@U
I Matrix Calculations
Use the matrix command menu to perform matrix calculation operations.
[OPTN]-[MAT]
S To display the matrix commands
1. Press * to specify a column and a list...
User Guide - Page 102
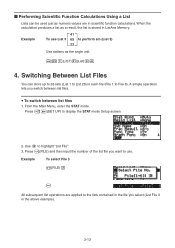
... files. Use A to display the STAT mode Setup screen.
2. Press (FILE) and then input the number of the list file you switch between list files
1. I Performing Scientific Function Calculations Using a List
Lists can store up to 26 lists (List 1 to List 26) in each file (File 1 to File 6).
A simple operation lets you want...
User Guide - Page 111
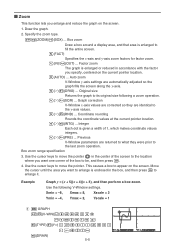
...enlarge it.
Original size Returns the graph to the y-axis values.
(E)(RND) ...
Box zoom range specification
3. Example
Graph y = (x + 5)(x + 4)(x + 3), and then perform a box zoom. Auto zoom
V-Window... graph fills the screen along the y-axis.
(E)(ORIG) ... I Zoom
This function lets you enlarge and reduce the graph on the current pointer location.
(AUTO) ... Draw the graph....
User Guide - Page 117
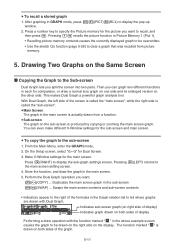
... window.
2. You can graph two different functions in GRAPH mode, press *(PICT)(RCL) to clear a graph that was recalled from a function. Press a number key to the right of display
Performing a draw operation with Dual Graph. Press (RIGHT) to the main screen setting screen. 4. With Dual Graph, the left side of the graph.
5-11 S To copy the graph to recall, and...
User Guide - Page 128
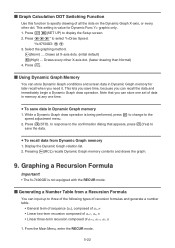
... only. 1. Press \AAA* to display the Setup screen. 2. I Using Dynamic Graph Memory
You can store one set of data in memory at any one time. While a Dynamic Graph draw operation is not equipped with the RECUR mode.
I Graph Calculation DOT Switching Function
Use this function to specify drawing of all X-axis dots. (initial default) (High) ... Display...
User Guide - Page 133
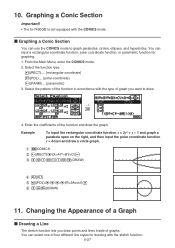
..., circles, ellipses, and hyperbolas. Select the function type.
(RECT).... {rectangular coordinate} (POL).... {polar coordinate} (PARM).... {parametric} 3. You can use the CONICS mode to draw.
1 U
4.
Changing the Appearance of a Graph
I Graphing a Conic Section
You can select one of graphs. Graphing a Conic Section
Important! • The fx-7400Gɉ is not equipped with the...
User Guide - Page 158
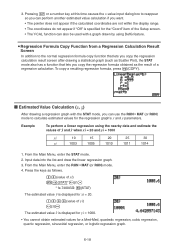
..., quadratic regression, cubic regression, quartic regression, sinusoidal regression, or logistic regression graph.
6-18 A?(value of xi) *(STAT)*(ţ)U
* fx-7400GII: (STAT) The estimated value ţ is displayed for xi = 20.
@???(value of the Setup screen. • The Y-CAL function can perform another estimated value calculation if you copy the regression formula obtained as follows.
User Guide - Page 228
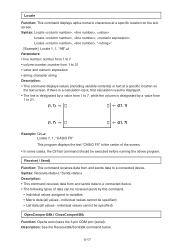
...variables • Matrix data (all ...CASIO FX" This program displays the text "CASIO FX" in the center of data can be specified) • List data (all values - individual values cannot be executed before running the above program. If there is a calculation input, that calculation result is displayed.
• The line is designated by a value from 1 to a connected device. Locate
Function...
User Guide - Page 233
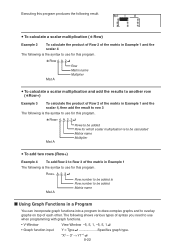
...+ A, 2, 3= Mat A
Row number to be added to Row number to be calculated Matrix name Multiplier
S To add two rows (Row+)
Example 4 To add Row 2 to Row 3 of the matrix in a Program
You can incorporate graph functions into a program to draw complex graphs and to overlay graphs on top of syntax you need to use for this program...
User Guide - Page 235
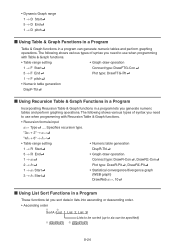
... type: DrawR-Plt=, DrawR3-Plt=
1 m an Start= 3 m bn Start=
• Statistical convergence/divergence graph (WEB graph)
DrawWeb an+1, 10=
I Using Recursion Table & Graph Functions in a Program
Incorporating Recursion Table & Graph functions in a program lets you generate numeric tables and perform graphing operations. The following shows various types of syntax you sort data in a program...
User Guide - Page 283
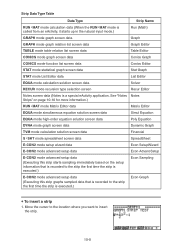
... mode.)
Strip Name Run (Math)
GRAPH mode graph screen data GRAPH mode graph relation list screen data TABLE mode table relation list screen data CONICS mode graph screen data
Graph Graph Editor Table Editor Conics Graph
CONICS mode function list screen data STAT mode statistical graph screen data STAT mode List Editor data EQUA mode calculation solution screen data
Conics Editor...
User Guide - Page 306
... PC using fx9860G Manager PLUS Screen Receiver function}
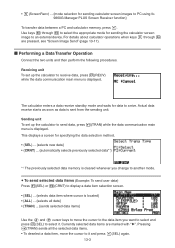
To transfer data between a PC and calculator memory, press . Pressing (TRAN) sends all data} • {TRAN} ... {sends selected data items}
Use the D and A cursor keys to move the cursor to it . Use keys through are marked with " C". I Performing a Data Transfer Operation
Connect the two units...
User Guide - Page 316
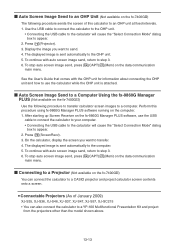
... fixed intervals. 1. I Auto Screen Image Send to an OHP Unit (Not available on the fx-7400GII)
The following procedure to transfer calculator screen images to a CASIO projector and project calculator screen contents onto a screen.
Perform this calculator to transfer. 4. S Connectable Projectors (As of this procedure using fx-9860G Manager PLUS software running on the computer. 1.
User Guide - Page 381
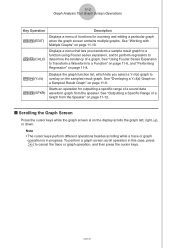
K5(Y=fx)
Displays the graph function list, which lets you transform a sample result graph to a function using Fourier series expansion, and to perform regression to a Function" on page 11-6, and "Performing Regression" on page 11-8.
To perform a graph screen scroll operation in progress. k Scrolling the Graph Screen
Press the cursor keys while the graph screen is in this case, press ...
User Guide - Page 388
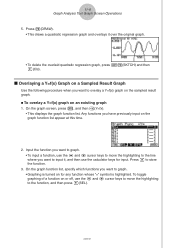
... it , and then use the calculator keys for any function whose "=" symbol is highlighted. k Overlaying a Y=f(x) Graph on a Sampled Result Graph
Use the following procedure when you want to the line where you have previously input on an existing graph
1. On the graph function list, specify which functions you want to graph. • To input a function, use the f and c cursor keys...
Similar Questions

How To Perform Matrix Multiplication In Casio Fx-991ms
(Posted by jamreen 9 years ago)
Casio Graphing Calculator Fx-9750gii How To Put In Degree Mode
(Posted by highgFishf 10 years ago)


Where Is The History Function On The Fx-9750gii
(Posted by bugnuBooz 10 years ago)