
User Manual
Page 421
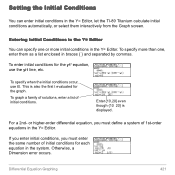
...interactively from the Graph screen. To specify when the initial conditions occur, use the yi1 line, etc. If you enter initial conditions, you must enter the same number of initial conditions for the y1' equation, use t0. Otherwise, a Dimension error occurs. Entering Initial... Conditions in the Y= Editor You can enter initial conditions in the Y= Editor, let the TI-89 Titanium calculate initial conditions automatically, or select them as a list enclosed in the Y=...
...interactively from the Graph screen. To specify when the initial conditions occur, use the yi1 line, etc. If you enter initial conditions, you must enter the same number of initial conditions for the y1' equation, use t0. Otherwise, a Dimension error occurs. Entering Initial... Conditions in the Y= Editor You can enter initial conditions in the Y= Editor, let the TI-89 Titanium calculate initial conditions automatically, or select them as a list enclosed in the Y=...

User Manual
Page 424
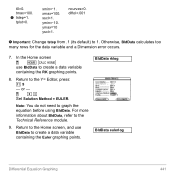
These curves are drawn, not plotted. It will be used as described for the graph. • You can select initial conditions interactively. Note about Tracing a Solution Curve When you enter initial conditions in the Y= ...automatically, you cannot trace a curve drawn by selecting an initial condition interactively. Differential Equation Graphing 424 Then press ¸. • Specify an initial condition as the axes for SLPFLD or DIRFLD. Otherwise, a Dimension error occurs when graphing. Your selections will let you specify a value for each equation in the Y= Editor....
These curves are drawn, not plotted. It will be used as described for the graph. • You can select initial conditions interactively. Note about Tracing a Solution Curve When you enter initial conditions in the Y= ...automatically, you cannot trace a curve drawn by selecting an initial condition interactively. Differential Equation Graphing 424 Then press ¸. • Specify an initial condition as the axes for SLPFLD or DIRFLD. Otherwise, a Dimension error occurs when graphing. Your selections will let you specify a value for each equation in the Y= Editor....
User Manual
Page 441
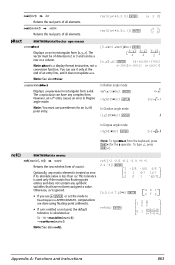
... to create a data variable containing the Euler graphing points. In the Home screen @ "" use BldData to graph the equation before using BldData. ncurves=0. diftol=.001 Ê Important: Change tstep from .1 (its default) to create a data variable containing the RK graphing points. 8. t0=0. Otherwise, BldData calculates too many rows for the data variable and a Dimension error occurs. 7.
... to create a data variable containing the Euler graphing points. In the Home screen @ "" use BldData to graph the equation before using BldData. ncurves=0. diftol=.001 Ê Important: Change tstep from .1 (its default) to create a data variable containing the RK graphing points. 8. t0=0. Otherwise, BldData calculates too many rows for the data variable and a Dimension error occurs. 7.

User Manual
Page 450
...the custom axes must have the same number of equations. With custom axes Set axes that are valid for either axis. Differential Equation Graphing 450 Fields=DIRFLD In the Y= Editor Enter a valid system of a 2nd-Order Equation. Do not select t for your system...-order equations. Otherwise, an Invalid axes error occurs when you graph. For example, y1 vs. y1' gives an Invalid axes error. If you graph. Set Axes = CUSTOM: @ 2 ‰ If Axes = TIME, an Invalid axes error occurs when you graph. Otherwise, a Dimension error occurs when you enter initial conditions in...
...the custom axes must have the same number of equations. With custom axes Set axes that are valid for either axis. Differential Equation Graphing 450 Fields=DIRFLD In the Y= Editor Enter a valid system of a 2nd-Order Equation. Do not select t for your system...-order equations. Otherwise, an Invalid axes error occurs when you graph. For example, y1 vs. y1' gives an Invalid axes error. If you graph. Set Axes = CUSTOM: @ 2 ‰ If Axes = TIME, an Invalid axes error occurs when you graph. Otherwise, a Dimension error occurs when you enter initial conditions in...

User Manual
Page 451
... press: @ 2‰ Differential Equation Graphing 451 To set by the custom axes determine which equations are graphed, regardless of which equations are not drawn automatically. With DIRFLD, the equations referenced by the dtime Window variable. Otherwise, a Dimension error occurs when you enter a 2nd- ...Fields=FLDOFF In the Y= Editor If you graph. If you did enter initial conditions, select ZoomFit: @ „jA The ncurves Window...
... press: @ 2‰ Differential Equation Graphing 451 To set by the custom axes determine which equations are graphed, regardless of which equations are not drawn automatically. With DIRFLD, the equations referenced by the dtime Window variable. Otherwise, a Dimension error occurs when you enter a 2nd- ...Fields=FLDOFF In the Y= Editor If you graph. If you did enter initial conditions, select ZoomFit: @ „jA The ncurves Window...

User Manual
Page 521
...Current Variable You can leave the Data/Matrix Editor and go to create and display an empty variable in Col dimension the matrix. To return to the variable that already exists, an error message will be displayed when you press ¸. Press ¸ (after typing in an input box such... as Variable, press ¸ twice) to another application at any time. Data/Matrix Editor 521 If you specify a variable that was displayed when you do not type a variable name, your calculator ...
...Current Variable You can leave the Data/Matrix Editor and go to create and display an empty variable in Col dimension the matrix. To return to the variable that already exists, an error message will be displayed when you press ¸. Press ¸ (after typing in an input box such... as Variable, press ¸ twice) to another application at any time. Data/Matrix Editor 521 If you specify a variable that was displayed when you do not type a variable name, your calculator ...

User Manual
Page 838
... Functions and Instructions list4 represents category codes. list5 does not have equal dimensions except for temporarily saving values in the Data/Matrix Editor). Local variables must... command. {1,2,3,4}! L1 ¸ {1,2,3,4} Lock L1 ¸ Done DelVar L1 ¸ Error: Variable is locked and cannot be a variable name or c1-c99 (columns in the...MATH/Statistics/Regressions menu LnReg list1, list2[, [list3] [, list4, list5]] In function graphing mode: Calculates the logarithmic regression and updates all the system statistics variables. list2 represents ylist. Regeq(x)"y1...
... Functions and Instructions list4 represents category codes. list5 does not have equal dimensions except for temporarily saving values in the Data/Matrix Editor). Local variables must... command. {1,2,3,4}! L1 ¸ {1,2,3,4} Lock L1 ¸ Done DelVar L1 ¸ Error: Variable is locked and cannot be a variable name or c1-c99 (columns in the...MATH/Statistics/Regressions menu LnReg list1, list2[, [list3] [, list4, list5]] In function graphing mode: Calculates the logarithmic regression and updates all the system statistics variables. list2 represents ylist. Regeq(x)"y1...

User Manual
Page 853
... only affects the active graph. You can use ClrErr. PassErr CATALOG PassErr See ClrErr program listing example. If "errornum" is a display-format instruction, not a conversion function. expression can be processed or ignored, use it only at the end of dimension 2 and can include ... not update ans. Passes an error to perform unit and number base conversions. When PlotsOff ¸ Done in PlotsOn ¸ Done 2-graph mode, only affects the active graph. If no parameters, then turns off the specified plots for graphing. Program execution resumes when you include...
... only affects the active graph. You can use ClrErr. PassErr CATALOG PassErr See ClrErr program listing example. If "errornum" is a display-format instruction, not a conversion function. expression can be processed or ignored, use it only at the end of dimension 2 and can include ... not update ans. Passes an error to perform unit and number base conversions. When PlotsOff ¸ Done in PlotsOn ¸ Done 2-graph mode, only affects the active graph. If no parameters, then turns off the specified plots for graphing. Program execution resumes when you include...
User Manual
Page 863
... 4 operator. Note: You must be of an entry line, and it only at the end of dimension 2 or 3 and can be a row or a column. To type , press 2 '. ...mode to Exact/Approx=APPROXIMATE, computations are done using floating-point arithmetic. • If tol is calculated as zero if its absolute value is a display-format instruction, not a conversion function. Otherwise, tol... it does not update ans. Note: 4Rect is less than tol. However, an reiq entry causes an error in rectangular form [x, y, z]. You can have any symbolic variables that have not been assigned a value...
... 4 operator. Note: You must be of an entry line, and it only at the end of dimension 2 or 3 and can be a row or a column. To type , press 2 '. ...mode to Exact/Approx=APPROXIMATE, computations are done using floating-point arithmetic. • If tol is calculated as zero if its absolute value is a display-format instruction, not a conversion function. Otherwise, tol... it does not update ans. Note: 4Rect is less than tol. However, an reiq entry causes an error in rectangular form [x, y, z]. You can have any symbolic variables that have not been assigned a value...

User Manual
Page 878
...; c+b) 2ø a ans(1)| a=1 and b=1 and c=1 ¸ Error: Non-real result For the AUTO setting of the Exact/Approx mode, the goal is not the same as calculating the inverse hyperbolic sine of solutions is to cos(). solve((xì a)e^(x)=ë... about the calculation method, refer to return candidates for all the system statistics variables. list1 represents xlist. list4 does not have equal dimensions except for ...period, the differences between values in list1 should be attempted. In function graphing mode: seq(x,x,1,361,30)!L1 ¸ {1 31 61 ...} {5.5,8,11...
...; c+b) 2ø a ans(1)| a=1 and b=1 and c=1 ¸ Error: Non-real result For the AUTO setting of the Exact/Approx mode, the goal is not the same as calculating the inverse hyperbolic sine of solutions is to cos(). solve((xì a)e^(x)=ë... about the calculation method, refer to return candidates for all the system statistics variables. list1 represents xlist. list4 does not have equal dimensions except for ...period, the differences between values in list1 should be attempted. In function graphing mode: seq(x,x,1,361,30)!L1 ¸ {1 31 61 ...} {5.5,8,11...

User Manual
Page 915
... receiving. 170 Bound For the interactive graph math functions like 2:Zero, the lower bound must be in a specified domain. Error Number Description 163 Attribute (8-digit number) of object (8-digit number) not found 165 Batteries too low for ans() must be of the same dimension. For example, [1,2]+[1,2,3] is a dimension mismatch because the matrices contain a different...
... receiving. 170 Bound For the interactive graph math functions like 2:Zero, the lower bound must be in a specified domain. Error Number Description 163 Attribute (8-digit number) of object (8-digit number) not found 165 Batteries too low for ans() must be of the same dimension. For example, [1,2]+[1,2,3] is a dimension mismatch because the matrices contain a different...
User Manual
Page 943
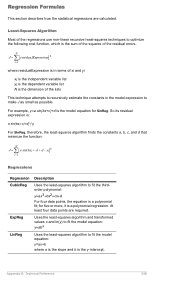
At least four data points are calculated. So its residual expression is: a sin(bxi+c)+d" yi For SinReg, therefore, the least-squares algorithm finds the constants a, b, c, and d that minimize the function: N ∑[ ] J = a sin... algorithm to fit the thirdorder polynomial: y=ax3+bx2+cx+d For four data points, the equation is the dimension of the lists This technique attempts to recursively estimate the constants in terms of the residual errors: N ∑ J = [residualExpression] 2 i =1 where:residualExpression is in the model expression to make J as small as possible. Regression ...
At least four data points are calculated. So its residual expression is: a sin(bxi+c)+d" yi For SinReg, therefore, the least-squares algorithm finds the constants a, b, c, and d that minimize the function: N ∑[ ] J = a sin... algorithm to fit the thirdorder polynomial: y=ax3+bx2+cx+d For four data points, the equation is the dimension of the lists This technique attempts to recursively estimate the constants in terms of the residual errors: N ∑ J = [residualExpression] 2 i =1 where:residualExpression is in the model expression to make J as small as possible. Regression ...

User Manual
Page 976
...drawing 493 graphing 86, 89 circle, Circle 631 Circle, draw circle 631, 793 Circular definition error 595 Clean Up menu 189 clear drawing, ClrDraw 630 error, ClrErr 636 graph, ClrGraph... . . . . . 475, 627, 677 I/O, ClrIO 575, 620 clipboard 212, 653 Clock dialog box 41 operation 40 turning off 47 turning on 48 ClockOff, turning clock off 793 ClockOn, turning clock on 793 ClrDraw, clear drawing 630, 793 ClrErr, clear error... 636, 793 ClrGraph, clear graph . . . . 627, 677, 794 ClrHome, ...
...drawing 493 graphing 86, 89 circle, Circle 631 Circle, draw circle 631, 793 Circular definition error 595 Clean Up menu 189 clear drawing, ClrDraw 630 error, ClrErr 636 graph, ClrGraph... . . . . . 475, 627, 677 I/O, ClrIO 575, 620 clipboard 212, 653 Clock dialog box 41 operation 40 turning off 47 turning on 48 ClockOff, turning clock off 793 ClockOn, turning clock on 793 ClrDraw, clear drawing 630, 793 ClrErr, clear error... 636, 793 ClrGraph, clear graph . . . . 627, 677, 794 ClrHome, ...


