User Guide
Page 50
... your graphing calculator. You can perform 16 hypothesis tests and confidence intervals and 15 distribution functions. For details, refer to the current cursor location. Chapter 1: Operating the TI-84 Plus Silver Edition 47 Documentation for additional Flash application guidebooks. Inferential Statistics You can display hypothesis test results graphically or numerically. Visit education.ti.com/calc/guides for TI Flash...
... your graphing calculator. You can perform 16 hypothesis tests and confidence intervals and 15 distribution functions. For details, refer to the current cursor location. Chapter 1: Operating the TI-84 Plus Silver Edition 47 Documentation for additional Flash application guidebooks. Inferential Statistics You can display hypothesis test results graphically or numerically. Visit education.ti.com/calc/guides for TI Flash...
User Guide
Page 114
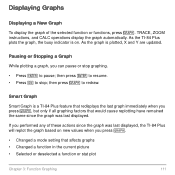
TRACE, ZOOM instructions, and CALC operations display the graph automatically. As the TI-84 Plus plots the graph, the busy indicator is on new values when you performed any of the selected function or functions, press s. Pausing or Stopping a Graph While plotting a graph, you press s, but only if all graphing factors that would cause replotting have remained the same since...
TRACE, ZOOM instructions, and CALC operations display the graph automatically. As the TI-84 Plus plots the graph, the busy indicator is on new values when you performed any of the selected function or functions, press s. Pausing or Stopping a Graph While plotting a graph, you press s, but only if all graphing factors that would cause replotting have remained the same since...
User Guide
Page 310
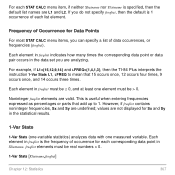
..., if freqlist contains noninteger frequencies, Sx and Sy are valid. For example, if L1={15,12,9,14} and ÙFREQ={1,4,1,3}, then the TI-84 Plus interprets the instruction 1-Var Stats L1, ÙFREQ to 1. This is useful when entering frequencies expressed as percentages or parts that add up to... statistics) analyzes data with one element must be , 0, and at least one measured variable. Frequency of Occurrence for Data Points For most STAT CALC menu items, you do not specify freqlist, then the default is 1 occurrence of occurrence for Sx and Sy in freqlist is the frequency of each...
..., if freqlist contains noninteger frequencies, Sx and Sy are valid. For example, if L1={15,12,9,14} and ÙFREQ={1,4,1,3}, then the TI-84 Plus interprets the instruction 1-Var Stats L1, ÙFREQ to 1. This is useful when entering frequencies expressed as percentages or parts that add up to... statistics) analyzes data with one element must be , 0, and at least one measured variable. Frequency of Occurrence for Data Points For most STAT CALC menu items, you do not specify freqlist, then the default is 1 occurrence of occurrence for Sx and Sy in freqlist is the frequency of each...

