User Guide
Page 8
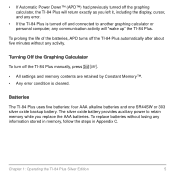
Turning Off the Graphing Calculator To turn off the TI-84 Plus automatically after about five minutes without losing any information stored in memory, follow the steps in Appendix C. Batteries The TI-84 Plus uses five batteries: four AAA alkaline batteries and one SR44SW... graphing calculator, the TI-84 Plus will "wake up" the TI-84 Plus. Chapter 1: Operating the TI-84 Plus Silver Edition 5 The silver oxide battery provides auxiliary power to another graphing calculator or personal computer, any activity. To prolong the life of the batteries, APD turns off the TI-84 Plus manually...
Turning Off the Graphing Calculator To turn off the TI-84 Plus automatically after about five minutes without losing any information stored in memory, follow the steps in Appendix C. Batteries The TI-84 Plus uses five batteries: four AAA alkaline batteries and one SR44SW... graphing calculator, the TI-84 Plus will "wake up" the TI-84 Plus. Chapter 1: Operating the TI-84 Plus Silver Edition 5 The silver oxide battery provides auxiliary power to another graphing calculator or personal computer, any activity. To prolong the life of the batteries, APD turns off the TI-84 Plus manually...
User Guide
Page 316
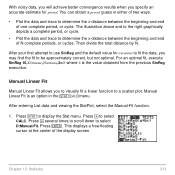
... you to visually fit a linear function to a scatter plot. You can obtain a period guess in the ... / menu. Press ~ to select D:Manual-Fit. to determine the x-distance between the beginning and end of N complete periods, or cycles. For an optimal fit, execute SinReg 16,Xlistname,Ylistname,...8226; Plot the data and trace to be approximately correct, but not optimal. Manual Linear Fit is the value obtained from the previous SinReg execution. Then divide the total distance by N. Manual Linear Fit Manual Linear Fit allows you may find the fit to determine the x-distance between ...
... you to visually fit a linear function to a scatter plot. You can obtain a period guess in the ... / menu. Press ~ to select D:Manual-Fit. to determine the x-distance between the beginning and end of N complete periods, or cycles. For an optimal fit, execute SinReg 16,Xlistname,Ylistname,...8226; Plot the data and trace to be approximately correct, but not optimal. Manual Linear Fit is the value obtained from the previous SinReg execution. Then divide the total distance by N. Manual Linear Fit Manual Linear Fit allows you may find the fit to determine the x-distance between ...
User Guide
Page 317
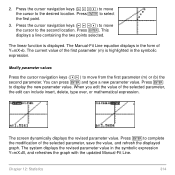
...cursor to display the new parameter value. The linear function is highlighted in the symbolic expression Y=mX+B, and refreshes the graph with the updated Manual-Fit Line. You can include insert, delete, type over, or mathematical expression. The screen dynamically displays the revised parameter ...value. The current value of the selected parameter, save the value, and refresh the displayed graph. 2. The Manual-Fit Line equation displays in the form of the selected parameter, the edit can press Í and type a new parameter value...
...cursor to display the new parameter value. The linear function is highlighted in the symbolic expression Y=mX+B, and refreshes the graph with the updated Manual-Fit Line. You can include insert, delete, type over, or mathematical expression. The screen dynamically displays the revised parameter ...value. The current value of the selected parameter, save the value, and refresh the displayed graph. 2. The Manual-Fit Line equation displays in the form of the selected parameter, the edit can press Í and type a new parameter value...
User Guide
Page 318
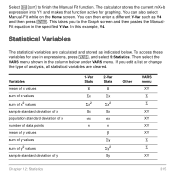
... Variables The statistical variables are cleared. Select y 5 to the Graph screen and then pastes the ManualFit equation in the specified Y-Var. You can also select Manual-Fit while on the Home screen. The calculator stores the current mX+b expression into Y1 and makes that function active for use in the ...Sx sx n w Gy Gy2 Sy Other VARS menu XY G G XY XY XY XY G G XY Chapter 12: Statistics 315 If you to finish the Manual Fit function. Variables mean of x values sum of x values sum of x2 values sample standard deviation of x population standard deviation of x number of data ...
... Variables The statistical variables are cleared. Select y 5 to the Graph screen and then pastes the ManualFit equation in the specified Y-Var. You can also select Manual-Fit while on the Home screen. The calculator stores the current mX+b expression into Y1 and makes that function active for use in the ...Sx sx n w Gy Gy2 Sy Other VARS menu XY G G XY XY XY XY G G XY Chapter 12: Statistics 315 If you to finish the Manual Fit function. Variables mean of x values sum of x values sum of x2 values sample standard deviation of x population standard deviation of x number of data ...
User Guide
Page 592
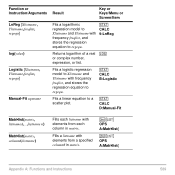
.... Function or Instruction/Arguments LnReg [Xlistname, Ylistname,freqlist, regequ] log(value) Logistic [Xlistname, Ylistname,freqlist, regequ] Manual-Fit equname Result Key or Keys/Menu or Screen/Item Fits a logarithmic regression model to Xlistname and Ylistname with frequency ..., and stores the regression equation to a scatter plot. ... Fills a listname with elements from a specified column# in matrix. CALC D:Manual-Fit Matr4list(matrix, listnameA,...,listname n) Matr4list(matrix, column#,listname) Fills each listname with elements from each column in matrix. y 9 OPS...
.... Function or Instruction/Arguments LnReg [Xlistname, Ylistname,freqlist, regequ] log(value) Logistic [Xlistname, Ylistname,freqlist, regequ] Manual-Fit equname Result Key or Keys/Menu or Screen/Item Fits a logarithmic regression model to Xlistname and Ylistname with frequency ..., and stores the regression equation to a scatter plot. ... Fills a listname with elements from a specified column# in matrix. CALC D:Manual-Fit Matr4list(matrix, listnameA,...,listname n) Matr4list(matrix, column#,listname) Fills each listname with elements from each column in matrix. y 9 OPS...
User Guide
Page 671
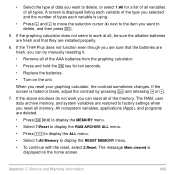
If the TI-84 Plus does not function even though you are sure that they are...Select the type of data you want to delete, and then press {. 5. If the graphing calculator does not seem to work you want to the item you can try manually resetting it. • Remove all of all memory. If the screen is displayed on the...8226; Press ~ ~ to display the ALL menu. • Select 1:All Memory to factory settings when you reset your graphing calculator, the contrast sometimes changes. All nonsystem variables, applications (Apps), and programs are restored to display the RESET MEMORY menu. &#...
If the TI-84 Plus does not function even though you are sure that they are...Select the type of data you want to delete, and then press {. 5. If the graphing calculator does not seem to work you want to the item you can try manually resetting it. • Remove all of all memory. If the screen is displayed on the...8226; Press ~ ~ to display the ALL menu. • Select 1:All Memory to factory settings when you reset your graphing calculator, the contrast sometimes changes. All nonsystem variables, applications (Apps), and programs are restored to display the RESET MEMORY menu. &#...
User Guide
Page 684
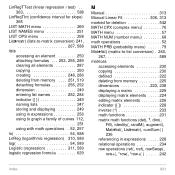
... formulas 256, 292 dimension 249 entering list names 252, 284 indicator 249 naming lists 247 storing and displaying 249 using in expressions 256 using to graph a family of curves 112, 251 using with math operations . 52, 257 ln 54, 588 LnReg (logarithmic regression) 310, 589 log 54, 589 ...Logistic (regression 311, 589 logistic regression formula 629 M Manual 313 Manual Linear Fit 306, 313 marked for deletion 542 MATH CPX (complex menu 76 MATH menu 57 MATH NUM (number menu 68 math operations 52 MATH...
... formulas 256, 292 dimension 249 entering list names 252, 284 indicator 249 naming lists 247 storing and displaying 249 using in expressions 256 using to graph a family of curves 112, 251 using with math operations . 52, 257 ln 54, 588 LnReg (logarithmic regression) 310, 589 log 54, 589 ...Logistic (regression 311, 589 logistic regression formula 629 M Manual 313 Manual Linear Fit 306, 313 marked for deletion 542 MATH CPX (complex menu 76 MATH menu 57 MATH NUM (number menu 68 math operations 52 MATH...


