User Guide
Page 12
... When the TI-84 Plus is calculating or graphing, a vertical moving dotted line. Graphs and editors sometimes display additional cursors, which are entered at the cursor; any existing character is overwritten Underline __ A character is executed Checkerboard rectangle No entry; Chapter 1: Operating the TI-84 Plus Silver Edition...chapters. Cursor Entry Insert Second Alpha Full Appearance Effect of the cursor indicates what will happen when you pause a graph or a program, the busy indicator becomes a vertical moving line is full If you press y during an insertion, the cursor...
... When the TI-84 Plus is calculating or graphing, a vertical moving dotted line. Graphs and editors sometimes display additional cursors, which are entered at the cursor; any existing character is overwritten Underline __ A character is executed Checkerboard rectangle No entry; Chapter 1: Operating the TI-84 Plus Silver Edition...chapters. Cursor Entry Insert Second Alpha Full Appearance Effect of the cursor indicates what will happen when you pause a graph or a program, the busy indicator becomes a vertical moving line is full If you press y during an insertion, the cursor...
User Guide
Page 23
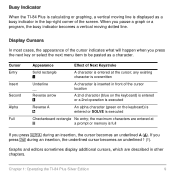
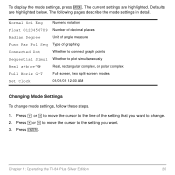
... following pages describe the mode settings in detail. Press ~ or | to move the cursor to the line of graphing Connected Dot Whether to connect graph points Sequential Simul Whether to plot simultaneously Real a+bi re^qi Real, rectangular complex, or polar complex Full Horiz ...2. Press † or } to move the cursor to change mode settings, follow these steps. 1. To display the mode settings, press z. Press Í. Chapter 1: Operating the TI-84 Plus Silver Edition 20 Normal Sci Eng Numeric notation Float 0123456789 Number of decimal places Radian Degree Unit of angle...
... following pages describe the mode settings in detail. Press ~ or | to move the cursor to the line of graphing Connected Dot Whether to connect graph points Sequential Simul Whether to plot simultaneously Real a+bi re^qi Real, rectangular complex, or polar complex Full Horiz ...2. Press † or } to move the cursor to change mode settings, follow these steps. 1. To display the mode settings, press z. Press Í. Chapter 1: Operating the TI-84 Plus Silver Edition 20 Normal Sci Eng Numeric notation Float 0123456789 Number of decimal places Radian Degree Unit of angle...
User Guide
Page 99
... 1 describes each mode setting. • Float or 0123456789 (fixed) decimal mode affects displayed graph coordinates. • Radian or Degree angle mode affects interpretation of some functions. • Connected or Dot plotting mode affects plotting of selected functions. • Sequential or Simul graphing-order mode affects function plotting when more than one or more defined...
... 1 describes each mode setting. • Float or 0123456789 (fixed) decimal mode affects displayed graph coordinates. • Radian or Degree angle mode affects interpretation of some functions. • Connected or Dot plotting mode affects plotting of selected functions. • Sequential or Simul graphing-order mode affects function plotting when more than one or more defined...

User Guide
Page 104
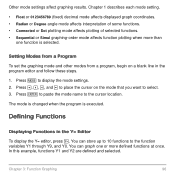
...Use the styles to visually differentiate functions to be graphed together. Setting Graph Styles for function graphing. • To turn on or turn off...the Y= Editor This table describes the graph styles available for Functions MATH Graph Style Icons in the Y= editor, ...and then turns on Y1 and Y3. Icon Style ç Line Description A solid line connects plotted points; Press Í. When the instruction is displayed.... For example, you can set and Done is executed, the status of each function in Connected mode Chapter 3: Function Graphing...
...Use the styles to visually differentiate functions to be graphed together. Setting Graph Styles for function graphing. • To turn on or turn off...the Y= Editor This table describes the graph styles available for Functions MATH Graph Style Icons in the Y= editor, ...and then turns on Y1 and Y3. Icon Style ç Line Description A solid line connects plotted points; Press Í. When the instruction is displayed.... For example, you can set and Done is executed, the status of each function in Connected mode Chapter 3: Function Graphing...

User Guide
Page 105
... Style è Thick é Above ê Below ë Path ì Animate í Dot Description A thick solid line connects plotted points Shading covers the area above . Press Í repeatedly to display the Y= editor. 2. Press o to rotate through the graph styles. this is displayed. (Steps 2 and 3 are not available in the first column. Press † and...
... Style è Thick é Above ê Below ë Path ì Animate í Dot Description A thick solid line connects plotted points Shading covers the area above . Press Í repeatedly to display the Y= editor. 2. Press o to rotate through the graph styles. this is displayed. (Steps 2 and 3 are not available in the first column. Press † and...

User Guide
Page 107
...editor. function# is the number of curves. To display this program is an integer from the PRGM CTL menu. Chapter 3: Function Graphing 104 graphstyle# is executed in Func mode, GraphStyle(1,3) sets Y1 to 7 that graphs a family of curves, such as shown below....) 4 = ê (below) 5 = ë (path) 6 = ì (animate) 7 = í (dot) GraphStyle(function#,graphstyle#) For example, when this menu, press while in the current graphing mode. Setting a Graph Style from a Program To set the graph style from a program, select H:GraphStyle( from 1 to é (above).
...editor. function# is the number of curves. To display this program is an integer from the PRGM CTL menu. Chapter 3: Function Graphing 104 graphstyle# is executed in Func mode, GraphStyle(1,3) sets Y1 to 7 that graphs a family of curves, such as shown below....) 4 = ê (below) 5 = ë (path) 6 = ì (animate) 7 = í (dot) GraphStyle(function#,graphstyle#) For example, when this menu, press while in the current graphing mode. Setting a Graph Style from a Program To set the graph style from a program, select H:GraphStyle( from 1 to é (above).

User Guide
Page 122
...you move the cursor, the sides of the box lengthen or shorten proportionately on the graph becomes the zoom cursor (+), a smaller version of the free-moving cursor (+). The zoom cursor is displayed at the center of the box, and then press Í. Note: To cancel ZBox...values for current stat lists. Chapter 3: Function Graphing 119 Press |, }, ~, or †. Fits YMin and YMax between XMin and XMax. ZBox To define a new viewing window using ZBox, follow these steps. 1. Select 1:ZBox from the first defined corner, a small, square dot indicates the spot. 3. When you select 1:...
...you move the cursor, the sides of the box lengthen or shorten proportionately on the graph becomes the zoom cursor (+), a smaller version of the free-moving cursor (+). The zoom cursor is displayed at the center of the box, and then press Í. Note: To cancel ZBox...values for current stat lists. Chapter 3: Function Graphing 119 Press |, }, ~, or †. Fits YMin and YMax between XMin and XMax. ZBox To define a new viewing window using ZBox, follow these steps. 1. Select 1:ZBox from the first defined corner, a small, square dot indicates the spot. 3. When you select 1:...
User Guide
Page 140
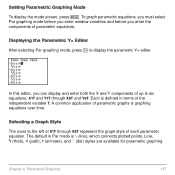
... mode screen, press z. Line, è (thick), ë (path), ì (animate), and í (dot) styles are available for parametric graphing. Chapter 4: Parametric Graphing 137 To graph parametric equations, you must select Par graphing mode before you enter window variables and before you can display and enter both the X and Y components of up to six equations, X1T and...
... mode screen, press z. Line, è (thick), ë (path), ì (animate), and í (dot) styles are available for parametric graphing. Chapter 4: Parametric Graphing 137 To graph parametric equations, you must select Par graphing mode before you enter window variables and before you can display and enter both the X and Y components of up to six equations, X1T and...

User Guide
Page 149
.... In this editor, you enter polar equations. Each is defined in Pol graphing mode is ç (line), which connects plotted points. Setting Polar Graphing Mode To display the mode screen, press z. Line, è (thick), ë (path), ì (animate), and í (dot) styles are available for the window variables and before you can enter and...
.... In this editor, you enter polar equations. Each is defined in Pol graphing mode is ç (line), which connects plotted points. Setting Polar Graphing Mode To display the mode screen, press z. Line, è (thick), ë (path), ì (animate), and í (dot) styles are available for the window variables and before you can enter and...
User Guide
Page 156
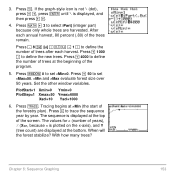
If the graph-style icon is not ç (dot), press | |, press Í until ç is plotted on the ... of the trees remain. Press r. Chapter 6: Sequence Graphing 153 Press à 1000 ¤ to select iPart( (integer part) because only whole trees are displayed at the top of years), X (X=n, because n is displayed, and then press ~ ~. 4. Press ...to define the new trees. Press † 4000 to set nMax=50. Set the other window variables. The sequence is displayed at the bottom. With how many trees? 3. After each harvest. Press † 50 to trace the sequence year by...
If the graph-style icon is not ç (dot), press | |, press Í until ç is plotted on the ... of the trees remain. Press r. Chapter 6: Sequence Graphing 153 Press à 1000 ¤ to select iPart( (integer part) because only whole trees are displayed at the top of years), X (X=n, because n is displayed, and then press ~ ~. 4. Press ...to define the new trees. Press † 4000 to set nMax=50. Set the other window variables. The sequence is displayed at the bottom. With how many trees? 3. After each harvest. Press † 50 to trace the sequence year by...

User Guide
Page 170
...) to the y=x reference line. 4. Make sure the graph style is set to í (dot), and then define nMin, u(n) and u(nMin) as you continue to press ~. It repeats this vertical and horizontal movement as shown below . Using Web Plots to display the sequence Y= editor. Press y . Í to graph the sequence. nMin=1 nMax=25 PlotStart=1 PlotStep...
...) to the y=x reference line. 4. Make sure the graph style is set to í (dot), and then define nMin, u(n) and u(nMin) as you continue to press ~. It repeats this vertical and horizontal movement as shown below . Using Web Plots to display the sequence Y= editor. Press y . Í to graph the sequence. nMin=1 nMax=25 PlotStart=1 PlotStep...

User Guide
Page 206
...mark]) Pt-Change(x,y) Note: If you select a pixel instruction from the Home Screen or a Program Pt-On( (point on) turns on the TI-84 Plus display. Pt-Change( does not have the mark option. When you specified mark to the home screen or the program editor. it determines the point's ... Drawing Pixels TI-84 Plus Pixels A pixel is optional; Chapter 8: Draw Instructions 203 Pt-Off( turns the point off the point with Pt-On(, you must specify mark when you turn off . Pt-Change( toggles the point on or off , or reverse a pixel (dot) on , turn on the graph using the cursor...
...mark]) Pt-Change(x,y) Note: If you select a pixel instruction from the Home Screen or a Program Pt-On( (point on) turns on the TI-84 Plus display. Pt-Change( does not have the mark option. When you specified mark to the home screen or the program editor. it determines the point's ... Drawing Pixels TI-84 Plus Pixels A pixel is optional; Chapter 8: Draw Instructions 203 Pt-Off( turns the point off the point with Pt-On(, you must specify mark when you turn off . Pt-Change( toggles the point on or off , or reverse a pixel (dot) on , turn on the graph using the cursor...

User Guide
Page 476
... the bottom-left corner. 5. The trace cursor jumps to trace along Y1, one X dot at a time, evaluating Y1 at X=3.8. 8. 4. The function that you are tracing is displayed on the Y1 function evaluated at each X. Press | and ~ to the point on the Y1 function. Press 3 Ë 8. ...The actual, precise maximum may lie between pixel values. This is displayed in the top-left corner. 7. Press Í. Chapter 17: Activities 473 You also can enter your estimate for the X pixel values. Press | and...
... the bottom-left corner. 5. The trace cursor jumps to trace along Y1, one X dot at a time, evaluating Y1 at X=3.8. 8. 4. The function that you are tracing is displayed on the Y1 function evaluated at each X. Press | and ~ to the point on the Y1 function. Press 3 Ë 8. ...The actual, precise maximum may lie between pixel values. This is displayed in the top-left corner. 7. Press Í. Chapter 17: Activities 473 You also can enter your estimate for the X pixel values. Press | and...
User Guide
Page 551
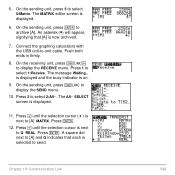
...the graphing calculators with the USB unit-to select 1:Receive. Press 1 to -unit cable. On the sending unit, press y 8 to Q REAL. Press Í. 12. Press † until the selection cursor ( 4 ) is next to send. A square dot next to [A] and Q indicates that [A] is next to display the ...SEND menu. 10. Press † until the selection cursor is now archived. 7. An asterisk (ä) will appear, signifying that each is displayed. 11. Chapter 19: Communication Link 548 5. ...
...the graphing calculators with the USB unit-to select 1:Receive. Press 1 to -unit cable. On the sending unit, press y 8 to Q REAL. Press Í. 12. Press † until the selection cursor ( 4 ) is next to send. A square dot next to [A] and Q indicates that [A] is next to display the ...SEND menu. 10. Press † until the selection cursor is now archived. 7. An asterisk (ä) will appear, signifying that each is displayed. 11. Chapter 19: Communication Link 548 5. ...

User Guide
Page 578
Function or Instruction/Arguments DispTable value4DMS Dot DrawF expression DrawInv expression :DS
Function or Instruction/Arguments DispTable value4DMS Dot DrawF expression DrawInv expression :DS
User Guide
Page 670
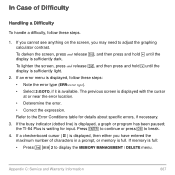
The previous screen is full: • Press y L 2 to adjust the graphing calculator contrast. Appendix C: Service and Warranty Information 667 Refer to break. 4. If memory is displayed with the cursor at or near the error location. • Deteremine the error. &#... until the display is sufficiently dark. the TI-84 Plus is displayed, a graph or program has been paused; If the busy indicator (dotted line) is waiting for details about specific errors, if necessary. 3. If a checkerboard cursor ( # ) is displayed, then either you may need to display the MEMORY MANAGEMENT...
The previous screen is full: • Press y L 2 to adjust the graphing calculator contrast. Appendix C: Service and Warranty Information 667 Refer to break. 4. If memory is displayed with the cursor at or near the error location. • Deteremine the error. &#... until the display is sufficiently dark. the TI-84 Plus is displayed, a graph or program has been paused; If the busy indicator (dotted line) is waiting for details about specific errors, if necessary. 3. If a checkerboard cursor ( # ) is displayed, then either you may need to display the MEMORY MANAGEMENT...


