User Manual
Page 28
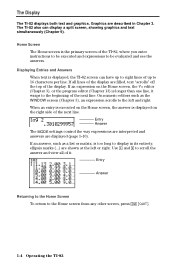
... simultaneously (Chapter 9). If an expression on the right side of it wraps to the beginning of the TI.82, where you enter instructions to be executed and expressions to the left or right. On numeric editors such as a list or matrix, is longer than one line, it . Use ~ and | to scroll... program editor (Chapter 13) is too long to 16 characters per line. Entry Answer Returning to the Home Screen To return to eight lines of the display are displayed (page 1.10). The TI.82 also can have up to the Home screen from any other screen, press y ãQUITä. 1-4 Operating the TI.82 ...
... simultaneously (Chapter 9). If an expression on the right side of it wraps to the beginning of the TI.82, where you enter instructions to be executed and expressions to the left or right. On numeric editors such as a list or matrix, is longer than one line, it . Use ~ and | to scroll... program editor (Chapter 13) is too long to 16 characters per line. Entry Answer Returning to the Home Screen To return to eight lines of the display are displayed (page 1.10). The TI.82 also can have up to the Home screen from any other screen, press y ãQUITä. 1-4 Operating the TI.82 ...
User Manual
Page 30
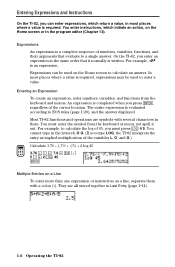
... can enter expressions, which initiate an action, on the Home screen or in them with several characters in the program editor (Chapter 13). An expression is an expression. Most TI.82 functions and operations are all stored together in the same order that evaluate to a single answer. You must press...in most places where a value is a complete sequence of the cursor location. Entering Expressions and Instructions On the TI.82, you can be used on the Home screen to calculate an answer. For example, pR2 is completed when you enter an expression in Last Entry (page 1.14). ...
... can enter expressions, which initiate an action, on the Home screen or in them with several characters in the program editor (Chapter 13). An expression is an expression. Most TI.82 functions and operations are all stored together in the same order that evaluate to a single answer. You must press...in most places where a value is a complete sequence of the cursor location. Entering Expressions and Instructions On the TI.82, you can be used on the Home screen to calculate an answer. For example, pR2 is completed when you enter an expression in Last Entry (page 1.14). ...
User Manual
Page 33
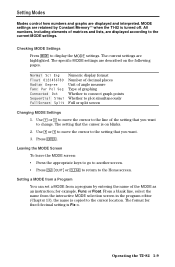
...to the line of matrices and lists, are displayed according to change. Setting a MODE from a Program You can set a MODE from the interactive MODE selection screen in the program editor (Chapter 13); the name is on the following pages. All numbers, including elements of the ...graphing Whether to connect graph points Whether to the setting that you want to the current MODE settings. for fixed decimal setting is turned off. MODE settings are described on blinks. 2. Press Í. From a blank line, select the name from a program by Constant Memoryé when the TI.82...
...to the line of matrices and lists, are displayed according to change. Setting a MODE from a Program You can set a MODE from the interactive MODE selection screen in the program editor (Chapter 13); the name is on the following pages. All numbers, including elements of the ...graphing Whether to connect graph points Whether to the setting that you want to the current MODE settings. for fixed decimal setting is turned off. MODE settings are described on blinks. 2. Press Í. From a blank line, select the name from a program by Constant Memoryé when the TI.82...
User Manual
Page 36
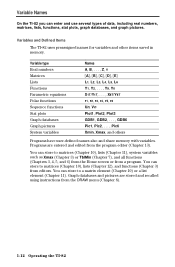
... (Chapter 3) from the DRAW menu (Chapter 8). 1-12 Operating the TI.82 Variable Names On the TI.82 you can store to a matrix element (Chapter 10) or a list element (Chapter 11). Programs are stored and recalled using instructions from editors. Graph databases and pictures are entered and edited from a program. Variable type Real numbers Matrices Lists Functions Parametric equations...
... (Chapter 3) from the DRAW menu (Chapter 8). 1-12 Operating the TI.82 Variable Names On the TI.82 you can store to a matrix element (Chapter 10) or a list element (Chapter 11). Programs are stored and recalled using instructions from editors. Graph databases and pictures are entered and edited from a program. Variable type Real numbers Matrices Lists Functions Parametric equations...
User Manual
Page 37
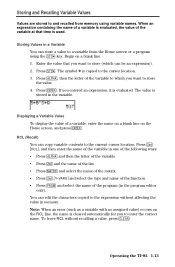
... from memory using the ¿ key. Begin on the Home screen, and press Í. Press ¿. Press Í. Storing Values in the program editor only). Note: When an error (such as a variable with no assigned value) occurs on the RCL line, the name is cleared automatically for you... current cursor location. Press ƒ, then the letter of a variable, enter the name on a blank line on a blank line. 1. Operating the TI.82 1-13 To leave RCL without affecting the value in the variable. The symbol ! Storing and Recalling Variable Values Values are stored to the cursor location...
... from memory using the ¿ key. Begin on the Home screen, and press Í. Press ¿. Press Í. Storing Values in the program editor only). Note: When an error (such as a variable with no assigned value) occurs on the RCL line, the name is cleared automatically for you... current cursor location. Press ƒ, then the letter of a variable, enter the name on a blank line on a blank line. 1. Operating the TI.82 1-13 To leave RCL without affecting the value in the variable. The symbol ! Storing and Recalling Variable Values Values are stored to the cursor location...
User Manual
Page 38
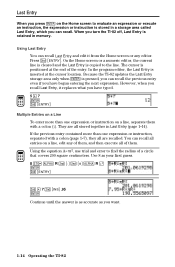
...can recall. Press y ãENTRYä. However, when you recall Last Entry, it from the Home screen or any of the entry. In the program editor, the Last Entry is inserted at the end of them, and then execute all stored together in Last Entry (page 1.14). If the previous entry...all of a circle that covers 200 square centimeters. On the Home screen or a numeric editor, the current line is cleared and the Last Entry is positioned at the cursor location. They are recalled. Because the TI.82 updates the Last Entry storage area only when Í is pressed, you can recall all...
...can recall. Press y ãENTRYä. However, when you recall Last Entry, it from the Home screen or any of the entry. In the program editor, the Last Entry is inserted at the end of them, and then execute all stored together in Last Entry (page 1.14). If the previous entry...all of a circle that covers 200 square centimeters. On the Home screen or a numeric editor, the current line is cleared and the Last Entry is positioned at the cursor location. They are recalled. Because the TI.82 updates the Last Entry storage area only when Í is pressed, you can recall all...
User Manual
Page 66
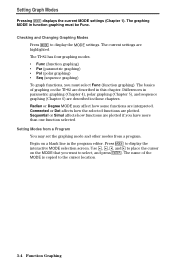
... may affect how some functions are described in the program editor. The current settings are plotted. Connected or Dot affects how the selected functions are highlighted. The TI.82 has four graphing modes. ¦ Func (function graphing) ¦ Par (parametric graphing) ¦ Pol (polar graphing) ¦ Seq (sequence graphing) To graph functions, you have more than one function selected. Press...
... may affect how some functions are described in the program editor. The current settings are plotted. Connected or Dot affects how the selected functions are highlighted. The TI.82 has four graphing modes. ¦ Func (function graphing) ¦ Par (parametric graphing) ¦ Pol (polar graphing) ¦ Seq (sequence graphing) To graph functions, you have more than one function selected. Press...
User Manual
Page 77
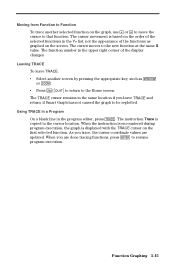
... displayed with the TRACE cursor on the screen. As you leave TRACE and return, if Smart Graph has not caused the graph to be replotted. The cursor movement is based on the order of the selected functions in the program editor, press r. Leaving TRACE To leave TRACE: ¦ Select another selected function on the...
... displayed with the TRACE cursor on the screen. As you leave TRACE and return, if Smart Graph has not caused the graph to be replotted. The cursor movement is based on the order of the selected functions in the program editor, press r. Leaving TRACE To leave TRACE: ¦ Select another selected function on the...
User Manual
Page 107
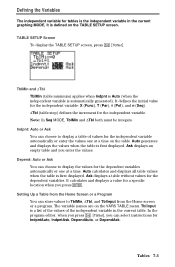
... Í. Auto generates and displays the values when the table is first displayed. Auto calculates and displays all table values when the table is first displayed. The variable names are ...Auto or Ask You can choose to display a table of the independent variable in the current graphing MODE. Depend: Auto or Ask You can choose to display the values for the independent ...values to TblMin, @Tbl, and TblZnput from the Home Screen or a Program You can select instructions for the dependent variables. In the program editor, when you press y [TblSet], you enter the values. Tables 7-3 ...
... Í. Auto generates and displays the values when the table is first displayed. Auto calculates and displays all table values when the table is first displayed. The variable names are ...Auto or Ask You can choose to display a table of the independent variable in the current graphing MODE. Depend: Auto or Ask You can choose to display the values for the independent ...values to TblMin, @Tbl, and TblZnput from the Home Screen or a Program You can select instructions for the dependent variables. In the program editor, when you press y [TblSet], you enter the values. Tables 7-3 ...

User Manual
Page 117
... interactive operation. It draws expression as a function in terms of X on the current graph. You must be in expression to draw a family of a function on the current graph. Drawing an Inverse of X on the Home screen or in the program editor. It draws the inverse of an expression in terms of a Function DrawInv (draw...
... interactive operation. It draws expression as a function in terms of X on the current graph. You must be in expression to draw a family of a function on the current graph. Drawing an Inverse of X on the Home screen or in the program editor. It draws the inverse of an expression in terms of a Function DrawInv (draw...

User Manual
Page 118
resolution=2 shades every second pixel. It draws lowerfunc and upperfunc in the program editor. resolution=1 shades every pixel. If Xleft or Xright are not specified, Xmin and Xmax are shaded. Shading a Graph Shade( (DRAW DRAW item 7) is specifically above lowerfunc and below one specified function and above another, between ...1 is both below upperfunc. resolution=3 shades every third pixel, and so on the Home screen or in terms of X on the current graph and shades the area that is used . You can specify Xleft (the left boundary) and Xright (the right boundary) for the shaded ...
resolution=2 shades every second pixel. It draws lowerfunc and upperfunc in the program editor. resolution=1 shades every pixel. If Xleft or Xright are not specified, Xmin and Xmax are shaded. Shading a Graph Shade( (DRAW DRAW item 7) is specifically above lowerfunc and below one specified function and above another, between ...1 is both below upperfunc. resolution=3 shades every third pixel, and so on the Home screen or in terms of X on the current graph and shades the area that is used . You can specify Xleft (the left boundary) and Xright (the right boundary) for the shaded ...

User Manual
Page 123
... screen MODE, the maximum value of row is 30 in the program editor. Pxl.On( (pixel on) (DRAW POINTS item 9) turns on the pixel at (row,column), where row is an integer between 0 and 62 and column is Off on the current graph. DRAW Operations 8-13 Drawing Pixels The Pxl (pixel) operations let... POINTS item 7) returns 1 if a pixel (row,column) is On or 0 if it is an integer between 0 and 62. The instruction must be entered on the graph using the cursor. TI.82 Pixels Turning Pixels On and Off The pixel instructions are not interactive.
... screen MODE, the maximum value of row is 30 in the program editor. Pxl.On( (pixel on) (DRAW POINTS item 9) turns on the pixel at (row,column), where row is an integer between 0 and 62 and column is Off on the current graph. DRAW Operations 8-13 Drawing Pixels The Pxl (pixel) operations let... POINTS item 7) returns 1 if a pixel (row,column) is On or 0 if it is an integer between 0 and 62. The instruction must be entered on the graph using the cursor. TI.82 Pixels Turning Pixels On and Off The pixel instructions are not interactive.

User Manual
Page 124
...STO menu. Press Í. Storing and Recalling Graph Pictures Press y < | to display the VARS PIC menu). Press y ãDRAWä | (to display the DRAW STO menu) 2 (to the Home screen or program editor. 2. RecallPic is superimposed. The current graph is displayed if necessary, and the picture ...is copied to the Home screen or program editor. 2. You cannot TRACE any curve on a picture. The picture does not include ...
...STO menu. Press Í. Storing and Recalling Graph Pictures Press y < | to display the VARS PIC menu). Press y ãDRAWä | (to display the DRAW STO menu) 2 (to the Home screen or program editor. 2. RecallPic is superimposed. The current graph is displayed if necessary, and the picture ...is copied to the Home screen or program editor. 2. You cannot TRACE any curve on a picture. The picture does not include ...

User Manual
Page 125
... current database is not plotted. (The TI.82 changes graphing MODE automatically, if necessary.) Deleting a Graph Database Graph databases are deleted from these elements. RecallGDB GDBn 3. Storing a Graph Database 1. StoreGDB is copied to select RecallGDB). Press y ãDRAWä | (to display the DRAW STO menu) 4 (to the Home screen or program editor. 2. Press Í. Press Í. The new...
... current database is not plotted. (The TI.82 changes graphing MODE automatically, if necessary.) Deleting a Graph Database Graph databases are deleted from these elements. RecallGDB GDBn 3. Storing a Graph Database 1. StoreGDB is copied to select RecallGDB). Press y ãDRAWä | (to display the DRAW STO menu) 4 (to the Home screen or program editor. 2. Press Í. Press Í. The new...
User Manual
Page 126
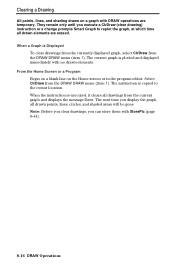
...drawn elements. They remain only until you display the graph, all drawn elements are temporary. Clearing a Drawing All points, lines, and shading drawn on the Home screen or in the program editor. Select ClrDraw from the current graph and displays the message Done. From the Home Screen... or a Program Begin on a blank line on a graph with StorePic (page 8.14). 8-16 DRAW Operations The next time you execute ...
...drawn elements. They remain only until you display the graph, all drawn elements are temporary. Clearing a Drawing All points, lines, and shading drawn on the Home screen or in the program editor. Select ClrDraw from the current graph and displays the message Done. From the Home Screen... or a Program Begin on a blank line on a graph with StorePic (page 8.14). 8-16 DRAW Operations The next time you execute ...
User Manual
Page 129
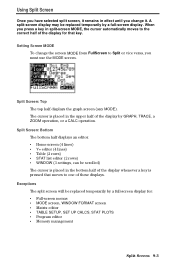
...half displays an editor. ¦ Home screen (4 lines) ¦ Y= editor (4 lines) ¦ Table (2 rows) ¦ STAT list editor (2 rows) ¦ WINDOW (3 settings, can be scrolled) The cursor is placed in the bottom half of the display whenever a key is placed in the upper half of the display by GRAPH, TRACE, a ... moves to the correct half of the display for : ¦ Full-screen menus ¦ MODE screen, WINDOW FORMAT screen ¦ Matrix editor ¦ TABLE SETUP, SET UP CALCS, STAT PLOTS ¦ Program editor ¦ Memory management Split Screen 9-3 The cursor is pressed that key.
...half displays an editor. ¦ Home screen (4 lines) ¦ Y= editor (4 lines) ¦ Table (2 rows) ¦ STAT list editor (2 rows) ¦ WINDOW (3 settings, can be scrolled) The cursor is placed in the bottom half of the display whenever a key is placed in the upper half of the display by GRAPH, TRACE, a ... moves to the correct half of the display for : ¦ Full-screen menus ¦ MODE screen, WINDOW FORMAT screen ¦ Matrix editor ¦ TABLE SETUP, SET UP CALCS, STAT PLOTS ¦ Program editor ¦ Memory management Split Screen 9-3 The cursor is pressed that key.
User Manual
Page 130
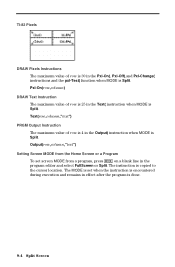
TI-82 Pixels DRAW Pixels Instructions The maximum value of row is 25 in the Text( instruction when MODE is Split. Pxl-On(row,column) DRAW Text ... pxl-Test( function when MODE is done. 9-4 Split Screen Output(row,column,"text") Setting Screen MODE from the Home Screen or a Program To set when the instruction is encountered during execution and remains in the program editor and select FullScreen or Split. The instruction is Split. The MODE is set screen MODE from...
TI-82 Pixels DRAW Pixels Instructions The maximum value of row is 25 in the Text( instruction when MODE is Split. Pxl-On(row,column) DRAW Text ... pxl-Test( function when MODE is done. 9-4 Split Screen Output(row,column,"text") Setting Screen MODE from the Home Screen or a Program To set when the instruction is encountered during execution and remains in the program editor and select FullScreen or Split. The instruction is Split. The MODE is set screen MODE from...
User Manual
Page 171
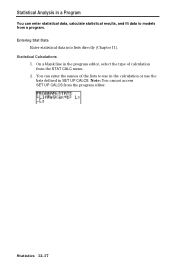
Note: You cannot access SET UP CALCS from the program editor. Statistics 12-17 You can enter statistical data, calculate statistical results, and fit data to use in the calculation or use the lists defined in SET UP CALCS. Statistical Calculations 1. On a blank line in the program editor, select the type of the lists to models from a program. Statistical Analysis in a Program You can enter the names of calculation from the STAT CALC menu. 2. Entering Stat Data Enter statistical data into lists directly (Chapter 11).
Note: You cannot access SET UP CALCS from the program editor. Statistics 12-17 You can enter statistical data, calculate statistical results, and fit data to use in the calculation or use the lists defined in SET UP CALCS. Statistical Calculations 1. On a blank line in the program editor, select the type of the lists to models from a program. Statistical Analysis in a Program You can enter the names of calculation from the STAT CALC menu. 2. Entering Stat Data Enter statistical data into lists directly (Chapter 11).
User Manual
Page 176
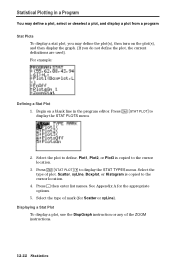
... Plots To display a stat plot, you may define the plot(s), then turn on a blank line in the program editor. Press y ãSTAT PLOTä to display the STAT TYPES menu. Press y ãSTAT PLOTä ~ to display the STAT PLOTS menu. 2. See Appendix A for .... 12-22 Statistics For example: Defining a Stat Plot 1. Scatter, xyLIne, Boxplot, or Histogram is copied to define. Begin on the plot(s), and then display the graph. (If you do not define the plot, the current definitions are used).
... Plots To display a stat plot, you may define the plot(s), then turn on a blank line in the program editor. Press y ãSTAT PLOTä to display the STAT TYPES menu. Press y ãSTAT PLOTä ~ to display the STAT PLOTS menu. 2. See Appendix A for .... 12-22 Statistics For example: Defining a Stat Plot 1. Scatter, xyLIne, Boxplot, or Histogram is copied to define. Begin on the plot(s), and then display the graph. (If you do not define the plot, the current definitions are used).

User Manual
Page 178
... select Function...). Press Í (to graph the family of curves 2 sin X, 4 sin X, and 6 sin X. 1. Press q. Press 6 (to display the PRGM NEW menu. 2. Press r. A program is copied to the cursor location. Press ~ ~ to select ZStandard). Press ƒ ã"ä (above Ã) y ã{ä 2 ¢.... 5. Getting Started: Family of Curves Getting Started is the beginning of a command line. 3. Note the : (colon) in the program editor. Press Í to select Create New...). Read the chapter for details. Press Í to the next line. Press Í to...
... select Function...). Press Í (to graph the family of curves 2 sin X, 4 sin X, and 6 sin X. 1. Press q. Press 6 (to display the PRGM NEW menu. 2. Press r. A program is copied to the cursor location. Press ~ ~ to select ZStandard). Press ƒ ã"ä (above Ã) y ã{ä 2 ¢.... 5. Getting Started: Family of Curves Getting Started is the beginning of a command line. 3. Note the : (colon) in the program editor. Press Í to select Create New...). Read the chapter for details. Press Í to the next line. Press Í to...

