User Manual
Page 6
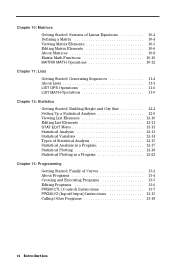
... 12-11 STAT EDIT Menu 12-12 Statistical Analysis 12-13 Statistical Variables 12-14 Types of Statistical Analysis 12-15 Statistical Analysis in a Program 12-17 Statistical Plotting 12-18 Statistical Plotting in a Program 12-22 Chapter 13: Programming Getting Started: Family of Curves 13-2 About Programs 13-4 Creating and Executing Programs 13-5 Editing Programs 13-6 PRGM CTL (Control) Instructions 13...
... 12-11 STAT EDIT Menu 12-12 Statistical Analysis 12-13 Statistical Variables 12-14 Types of Statistical Analysis 12-15 Statistical Analysis in a Program 12-17 Statistical Plotting 12-18 Statistical Plotting in a Program 12-22 Chapter 13: Programming Getting Started: Family of Curves 13-2 About Programs 13-4 Creating and Executing Programs 13-5 Editing Programs 13-6 PRGM CTL (Control) Instructions 13...
User Manual
Page 24
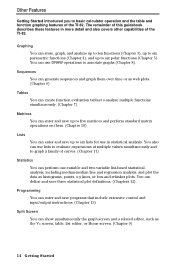
... guidebook describes these features in statistical analysis. Sequences You can generate sequences and graph them . (Chapter 10) Lists You can enter and save three statistical plot definitions. (Chapters 12). Programming You can enter and save programs that include extensive control and input...TI.82. You also can store, graph, and analyze up to ten functions (Chapter 3), up to six parametric functions (Chapter 4), and up to annotate graphs (Chapter 8). Other Features Getting Started introduced you to basic calculator operation and the table and function graphing features of the TI.82...
... guidebook describes these features in statistical analysis. Sequences You can generate sequences and graph them . (Chapter 10) Lists You can enter and save three statistical plot definitions. (Chapters 12). Programming You can enter and save programs that include extensive control and input...TI.82. You also can store, graph, and analyze up to ten functions (Chapter 3), up to six parametric functions (Chapter 4), and up to annotate graphs (Chapter 8). Other Features Getting Started introduced you to basic calculator operation and the table and function graphing features of the TI.82...
User Manual
Page 43
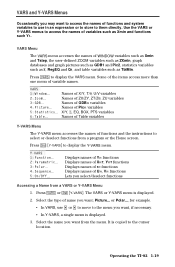
... Picture... Operating the TI.82 1-19 Press y ãY-VARSä to select or deselect functions from a program or the Home screen. Use the VARS or Y.VARS menus to access the names of variables such as TblMin. Names of name you want; Select the type of Picn variables 5: Statistics... X/Y, G, EQ... the names of WINDOW variables such as Xmin and Tstep, the user-defined ZOOM variables such as ZXmin, graph databases and graph pictures such as GDB1 and Pic2, statistics variables such as v, RegEQ and Q1, and table variables such as Xmin and functions such Y1. Names ...
... Picture... Operating the TI.82 1-19 Press y ãY-VARSä to select or deselect functions from a program or the Home screen. Use the VARS or Y.VARS menus to access the names of variables such as TblMin. Names of name you want; Select the type of Picn variables 5: Statistics... X/Y, G, EQ... the names of WINDOW variables such as Xmin and Tstep, the user-defined ZOOM variables such as ZXmin, graph databases and graph pictures such as GDB1 and Pic2, statistics variables such as v, RegEQ and Q1, and table variables such as Xmin and functions such Y1. Names ...

User Manual
Page 155
... Size ........ 12-2 Setting Up a Statistical Analysis 12-9 Viewing List Elements 12-10 Editing List Elements 12-11 STAT EDIT Menu 12-12 Statistical Analysis 12-13 Statistical Variables 12-14 Types of data, calculating statistical results, fitting data to a model, and plotting data. Chapter 12: Statistics This chapter describes the tools for analyzing statistical data on the TI.82.
... Size ........ 12-2 Setting Up a Statistical Analysis 12-9 Viewing List Elements 12-10 Editing List Elements 12-11 STAT EDIT Menu 12-12 Statistical Analysis 12-13 Statistical Variables 12-14 Types of data, calculating statistical results, fitting data to a model, and plotting data. Chapter 12: Statistics This chapter describes the tools for analyzing statistical data on the TI.82.
User Manual
Page 171
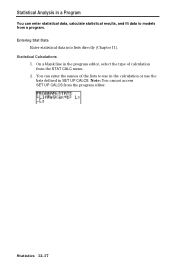
On a blank line in the program editor, select the type of the lists to models from a program. You can enter statistical data, calculate statistical results, and fit data to use in the calculation or use the lists defined in SET UP CALCS. Statistical Analysis in a Program You can enter the names of calculation from the program editor. Statistical Calculations 1. Note: You cannot access SET UP CALCS from the STAT CALC menu. 2. Entering Stat Data Enter statistical data into lists directly (Chapter 11). Statistics 12-17
On a blank line in the program editor, select the type of the lists to models from a program. You can enter statistical data, calculate statistical results, and fit data to use in the calculation or use the lists defined in SET UP CALCS. Statistical Analysis in a Program You can enter the names of calculation from the program editor. Statistical Calculations 1. Note: You cannot access SET UP CALCS from the STAT CALC menu. 2. Entering Stat Data Enter statistical data into lists directly (Chapter 11). Statistics 12-17
User Manual
Page 175
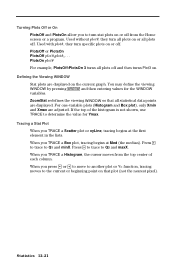
... plot#, they turn specific plots on or off. Defining the Viewing WINDOW Stat plots are displayed. ZoomStat redefines the viewing WINDOW so that all statistical data points are displayed on that plot (not the nearest pixel). If the top of each column. When you TRACE a Box plot, tracing ... turns all plots off from the Home screen or a program. When you press } or † to move to another plot or Y= function, tracing moves to the current or beginning point on the current graph. Press | to trace to Q3 and maxX. Statistics 12-21 Used with plot#, they turn stat plots on...
... plot#, they turn specific plots on or off. Defining the Viewing WINDOW Stat plots are displayed. ZoomStat redefines the viewing WINDOW so that all statistical data points are displayed on that plot (not the nearest pixel). If the top of each column. When you TRACE a Box plot, tracing ... turns all plots off from the Home screen or a program. When you press } or † to move to another plot or Y= function, tracing moves to the current or beginning point on the current graph. Press | to trace to Q3 and maxX. Statistics 12-21 Used with plot#, they turn stat plots on...
User Manual
Page 176
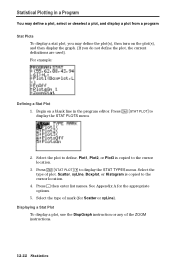
... Press ¢ then enter list names. Statistical Plotting in a Program You may define a plot, select or deselect a plot, and display a plot from a program Stat Plots To display a stat plot, you may define the plot(s), then turn on a blank line in the program editor. Plot1, Plot2, or Plot3 is copied...Press y ãSTAT PLOTä ~ to define. Select the type of the ZOOM instructions. 12-22 Statistics See Appendix A for Scatter or xyLine). Begin on the plot(s), and then display the graph. (If you do not define the plot, the current definitions are used). For example: Defining a Stat ...
... Press ¢ then enter list names. Statistical Plotting in a Program You may define a plot, select or deselect a plot, and display a plot from a program Stat Plots To display a stat plot, you may define the plot(s), then turn on a blank line in the program editor. Plot1, Plot2, or Plot3 is copied...Press y ãSTAT PLOTä ~ to define. Select the type of the ZOOM instructions. 12-22 Statistics See Appendix A for Scatter or xyLine). Begin on the plot(s), and then display the graph. (If you do not define the plot, the current definitions are used). For example: Defining a Stat ...

User Manual
Page 217
Select Delete.... 3. Press y ãMEMä to the MEMORY screen, press y ãMEMä. for example, Ans and statistical variables such RegEQ. To leave the DELETE display: ¦ To go to the Home screen, press y ãQUITä. ¦ To ...appears. 4. Memory Management 15-3 Deleting Items from Memory You can delete the contents of any variable (real number, list, matrix, Y= function), program, picture, or graph database from this screen. Note: Some system variables can continue to delete individual items from memory to increase available memory. You can 't be ...
Select Delete.... 3. Press y ãMEMä to the MEMORY screen, press y ãMEMä. for example, Ans and statistical variables such RegEQ. To leave the DELETE display: ¦ To go to the Home screen, press y ãQUITä. ¦ To ...appears. 4. Memory Management 15-3 Deleting Items from Memory You can delete the contents of any variable (real number, list, matrix, Y= function), program, picture, or graph database from this screen. Note: Some system variables can continue to delete individual items from memory to increase available memory. You can 't be ...
User Manual
Page 270
- D (Cont.) - 8DMS, 2-13, 2-14, A-5 DOMAIN error, B-7 Dot MODE, 1-9, 1-11, 3-4, A-5 DRAW menu, 8-3 to 8-11 Drawing DrawF, 8-7, A-5 function, 8-7 inverse function, 8-7 lines, 8-4 tfo 8-6 on a graph, 8-1 to 8-16 pixels, 8-13 points, 8-12 stat data, 12-6 to 12-8, 12-18 to 12-22 tangents, 8-6 DrawInv, 8-7, A-5, B-8 DS
- D (Cont.) - 8DMS, 2-13, 2-14, A-5 DOMAIN error, B-7 Dot MODE, 1-9, 1-11, 3-4, A-5 DRAW menu, 8-3 to 8-11 Drawing DrawF, 8-7, A-5 function, 8-7 inverse function, 8-7 lines, 8-4 tfo 8-6 on a graph, 8-1 to 8-16 pixels, 8-13 points, 8-12 stat data, 12-6 to 12-8, 12-18 to 12-22 tangents, 8-6 DrawInv, 8-7, A-5, B-8 DS

User Manual
Page 273
... 3-4, 4-3, 5-3, 9-3 MODE error, B-8 Modeling, 12-4 to 12-22 P - M (Cont.) - OFF, ON, 3, 1-2 1-Var Stats, 12-13, 12-14, A-13, B-9 One-variable statistics, 12-13, 12-14, B-9 or, 2-16, A-13 Output(, 9-4, 13-13, 13-15, A-13 OVERFLOW error, B-8 - Panning, 3-14, 4-6, 5-6, 6-6 Par MODE, 1-9, 1-11, 3-4,...19, 4-1 to 4-6 Parentheses, 1-21 Pause, 13-7, 13-10, 13-14, 13-15, 13-17, A-14 Pausing a graph, 3-11 Pausing a program, 13-10 Pen, 8-3, 8-11 Permutations, 2-12 Pi: p, 2-4 Piece-wise functions, graphing, 14-4 Pixel, 3-13, 8-12, 8-13, 9-4, A-15, B-4 Picn (pictures), 1-19, 8-14, A-28 Plotn(,...
... 3-4, 4-3, 5-3, 9-3 MODE error, B-8 Modeling, 12-4 to 12-22 P - M (Cont.) - OFF, ON, 3, 1-2 1-Var Stats, 12-13, 12-14, A-13, B-9 One-variable statistics, 12-13, 12-14, B-9 or, 2-16, A-13 Output(, 9-4, 13-13, 13-15, A-13 OVERFLOW error, B-8 - Panning, 3-14, 4-6, 5-6, 6-6 Par MODE, 1-9, 1-11, 3-4,...19, 4-1 to 4-6 Parentheses, 1-21 Pause, 13-7, 13-10, 13-14, 13-15, 13-17, A-14 Pausing a graph, 3-11 Pausing a program, 13-10 Pen, 8-3, 8-11 Permutations, 2-12 Pi: p, 2-4 Piece-wise functions, graphing, 14-4 Pixel, 3-13, 8-12, 8-13, 9-4, A-15, B-4 Picn (pictures), 1-19, 8-14, A-28 Plotn(,...

User Manual
Page 274
...statistics), 12-14, 12-15, A-28 R variable, 4-6, 5-5, 5-6, A-28 rn functions, 1-19, 5-3, A-28 Radian, 1-9, 1-11, 2-13, 3-4, A-16 rand, 2-12, A-16 randM(, 10-12, 10-13, 16-2, A-16 Random numbers, 2-12, 10-12, 10-13, 16-2, A-16 RANGE. POINTS (DRAW) menu, 8-12, 8-13 Pol MODE, 1-9, 1-11, 3-4, 5-3, A-14 Polar coordinates, 3-10, 4-6, 5-6, 6-5, A-14 Polar graphing... PrintScreen, 13-13, 13-17, A-14 Probability, 2-2, 2-12 prod, 11-9, 11-10, A-15 Product of a sequence, 11-10 PROGRAM editor, 9-3 Programs, 13-1 to 12-8 Return, 13-7, 13-12, A-16 root x‡, 2-5, 2-6, A-16 root, 3-21, 3-22, B-4 Root of...
...statistics), 12-14, 12-15, A-28 R variable, 4-6, 5-5, 5-6, A-28 rn functions, 1-19, 5-3, A-28 Radian, 1-9, 1-11, 2-13, 3-4, A-16 rand, 2-12, A-16 randM(, 10-12, 10-13, 16-2, A-16 Random numbers, 2-12, 10-12, 10-13, 16-2, A-16 RANGE. POINTS (DRAW) menu, 8-12, 8-13 Pol MODE, 1-9, 1-11, 3-4, 5-3, A-14 Polar coordinates, 3-10, 4-6, 5-6, 6-5, A-14 Polar graphing... PrintScreen, 13-13, 13-17, A-14 Probability, 2-2, 2-12 prod, 11-9, 11-10, A-15 Product of a sequence, 11-10 PROGRAM editor, 9-3 Programs, 13-1 to 12-8 Return, 13-7, 13-12, A-16 root x‡, 2-5, 2-6, A-16 root, 3-21, 3-22, B-4 Root of...

