User Manual
Page 3
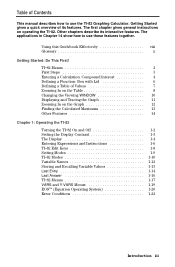
... to use these features together. The first chapter gives general instructions on the Graph 12 Finding the Calculated Maximum 13 Other Features 14 Chapter 1: Operating the TI.82 Turning the TI.82 On and Off 1-2 Setting the Display Contrast 1-3 The Display 1-4 Entering Expressions and Instructions 1-6 TI.82 Edit Keys 1-8 Setting Modes 1-9 TI.82 Modes 1-10 Variable Names 1-12 Storing and Recalling Variable...
... to use these features together. The first chapter gives general instructions on the Graph 12 Finding the Calculated Maximum 13 Other Features 14 Chapter 1: Operating the TI.82 Turning the TI.82 On and Off 1-2 Setting the Display Contrast 1-3 The Display 1-4 Entering Expressions and Instructions 1-6 TI.82 Edit Keys 1-8 Setting Modes 1-9 TI.82 Modes 1-10 Variable Names 1-12 Storing and Recalling Variable...
User Manual
Page 14
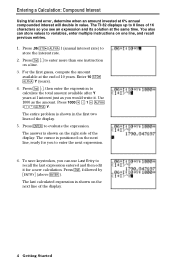
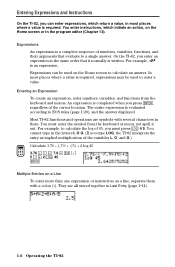
... variables, enter multiple instructions on one instruction on the next line of 10 years. The last calculated expression is positioned on the right side of 16 characters so you see an expression and its solution at 6% annual compounded interest will double in the first two lines of the display. 5. The TI.82 displays up to...
... variables, enter multiple instructions on one instruction on the next line of 10 years. The last calculated expression is positioned on the right side of 16 characters so you see an expression and its solution at 6% annual compounded interest will double in the first two lines of the display. 5. The TI.82 displays up to...
User Manual
Page 24
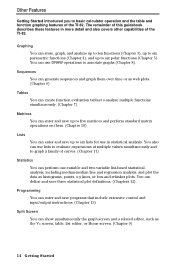
... functions (Chapter 3), up to six parametric functions (Chapter 4), and up to annotate graphs (Chapter 8). You can define and save programs that include extensive control and input/output instructions. (Chapter 13) Split Screen You can generate sequences and graph them . (Chapter 10) Lists You can enter and save three statistical plot definitions...(Chapter 6) Tables You can create function evaluation tables to analyze multiple functions simultaneously. (Chapter 7) Matrices You can enter and save up to basic calculator operation and the table and function graphing features of the TI.82.
... functions (Chapter 3), up to six parametric functions (Chapter 4), and up to annotate graphs (Chapter 8). You can define and save programs that include extensive control and input/output instructions. (Chapter 13) Split Screen You can generate sequences and graph them . (Chapter 10) Lists You can enter and save three statistical plot definitions...(Chapter 6) Tables You can create function evaluation tables to analyze multiple functions simultaneously. (Chapter 7) Matrices You can enter and save up to basic calculator operation and the table and function graphing features of the TI.82.
User Manual
Page 30
... keyboard and menus. You cannot type in them. Entering Expressions and Instructions On the TI.82, you can be used on the Home screen to a single answer. On the TI.82, you press Í, regardless of numbers, variables, functions, and their arguments that evaluate to calculate an answer. Expressions can enter expressions, which initiate an action...
... keyboard and menus. You cannot type in them. Entering Expressions and Instructions On the TI.82, you can be used on the Home screen to a single answer. On the TI.82, you press Í, regardless of numbers, variables, functions, and their arguments that evaluate to calculate an answer. Expressions can enter expressions, which initiate an action...
User Manual
Page 31
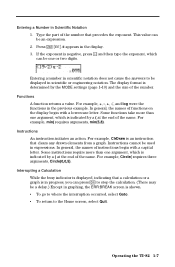
...functions on the display begin with a lowercase letter. Press y ãEEä. For example, ClrDraw is an instruction that a calculation or a graph is in graphing, the ERR:BREAK screen is shown. ¦ To go to where the interruption occurred, select Goto. ¦... 2. Entering a Number in the previous example. E appears in scientific or engineering notation. Operating the TI.82 1-7 Instructions An instruction initiates an action. Functions A function returns a value. Interrupting a Calculation While the busy indicator is indicated by a ( at the end of the name. This value can ...
...functions on the display begin with a lowercase letter. Press y ãEEä. For example, ClrDraw is an instruction that a calculation or a graph is in graphing, the ERR:BREAK screen is shown. ¦ To go to where the interruption occurred, select Goto. ¦... 2. Entering a Number in the previous example. E appears in scientific or engineering notation. Operating the TI.82 1-7 Instructions An instruction initiates an action. Functions A function returns a value. Interrupting a Calculation While the busy indicator is indicated by a ( at the end of the name. This value can ...
User Manual
Page 45
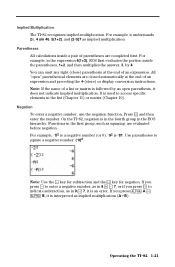
... All calculations inside the parentheses, 1+2, and then multiplies the answer, 3, by an open " parenthetical elements are closed automatically at the end of a list or matrix is interpreted as squaring, are completed first. Note: If the name of an expression. On the TI.82, negation...(Chapter 11) or matrix (Chapter 10). Operating the TI.82 1-21 For example, MX2 is M81. For example, in the expression 4(1+2), EOS first evaluates the portion inside a pair of an expression and preceding the ! (store) or display conversion instructions. If you press Ì to square a negative ...
... All calculations inside the parentheses, 1+2, and then multiplies the answer, 3, by an open " parenthetical elements are closed automatically at the end of a list or matrix is interpreted as squaring, are completed first. Note: If the name of an expression. On the TI.82, negation...(Chapter 11) or matrix (Chapter 10). Operating the TI.82 1-21 For example, MX2 is M81. For example, in the expression 4(1+2), EOS first evaluates the portion inside a pair of an expression and preceding the ! (store) or display conversion instructions. If you press Ì to square a negative ...
User Manual
Page 46
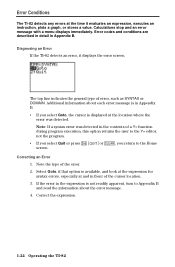
...Calculations stop and an error message with a menu displays immediately. If the error in Appendix B. ¦ If you return to Appendix B and read the information about each error message is in the expression is not readily apparent, turn to the Home screen. Diagnosing an Error If the TI.82... detects an error, it evaluates an expression, executes an instruction, plots a graph, or stores a value. Correcting an Error 1. Correct the expression. 1-22 Operating the TI.82 Select Goto, if that option is displayed at the ...
...Calculations stop and an error message with a menu displays immediately. If the error in Appendix B. ¦ If you return to Appendix B and read the information about each error message is in the expression is not readily apparent, turn to the Home screen. Diagnosing an Error If the TI.82... detects an error, it evaluates an expression, executes an instruction, plots a graph, or stores a value. Correcting an Error 1. Correct the expression. 1-22 Operating the TI.82 Select Goto, if that option is displayed at the ...
User Manual
Page 68
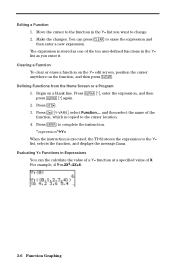
... Functions in the Y= list as one of the ten user-defined functions in Expressions You can press ' to complete the instruction. The expression is stored as you want to the Y= list, selects the function, and displays the message Done. Clearing ...calculate the value of a Y= function at a specified value of the function, which is executed, the TI.82 stores the expression to change. 2. Begin on the function, and then press '. Editing a Function 1. Make the changes. Move the cursor to the function in the Y= list you enter it. For example, if Y1=.2X3-2X+6: 3-6 Function Graphing...
... Functions in the Y= list as one of the ten user-defined functions in Expressions You can press ' to complete the instruction. The expression is stored as you want to the Y= list, selects the function, and displays the message Done. Clearing ...calculate the value of a Y= function at a specified value of the function, which is executed, the TI.82 stores the expression to change. 2. Begin on the function, and then press '. Editing a Function 1. Make the changes. Move the cursor to the function in the Y= list you enter it. For example, if Y1=.2X3-2X+6: 3-6 Function Graphing...
User Manual
Page 71
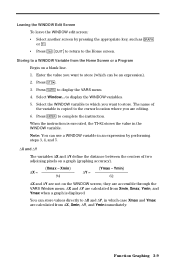
.... 6. The name of two adjoining pixels on a graph (graphing accuracy). @X = (Xmax - Storing to the cursor location where you are calculated from Xmin, Xmax, Ymin, and Ymax when a graph is executed, the TI.82 stores the value in which can store values directly to store. Press to complete the instruction. Function Graphing 3-9 to the Home screen. Ymin) 62...
.... 6. The name of two adjoining pixels on a graph (graphing accuracy). @X = (Xmax - Storing to the cursor location where you are calculated from Xmin, Xmax, Ymin, and Ymax when a graph is executed, the TI.82 stores the value in which can store values directly to store. Press to complete the instruction. Function Graphing 3-9 to the Home screen. Ymin) 62...
User Manual
Page 107
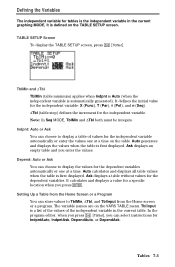
...press y [TblSet], you can choose to display a table of the independent variable in the current graphing MODE. It is defined on the VARS TABLE menu. TblMin and @Tbl TblMin (table minimum)...the TABLE SETUP screen, press y ãTblSetä. Indpnt: Auto or Ask You can select instructions for the independent variable. Depend: Auto or Ask You can store values to display the values ...for a specific location when you enter the values. It calculates and displays a value for the dependent variables automatically or one at a time. Defining the...
...press y [TblSet], you can choose to display a table of the independent variable in the current graphing MODE. It is defined on the VARS TABLE menu. TblMin and @Tbl TblMin (table minimum)...the TABLE SETUP screen, press y ãTblSetä. Indpnt: Auto or Ask You can select instructions for the independent variable. Depend: Auto or Ask You can store values to display the values ...for a specific location when you enter the values. It calculates and displays a value for the dependent variables automatically or one at a time. Defining the...
User Manual
Page 158
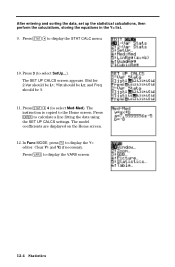
...display the VARS screen. 12-4 Statistics Ylist should be 1. 11. The model coefficients are displayed on the Home screen. 12. Press to calculate a line fitting the data using the SET UP CALCS settings. In Func MODE, press o to select SetUp...). Press 3 (to display the Y= editor...4 (to the Home screen. Clear Y1 and Y2 if necessary. The instruction is copied to select Med.Med). and Freq should be L1; After entering and sorting the data, set up the statistical calculations, then perform the calculations, storing the equations in the Y= list. 9. Press ... ~ to display...
...display the VARS screen. 12-4 Statistics Ylist should be 1. 11. The model coefficients are displayed on the Home screen. 12. Press to calculate a line fitting the data using the SET UP CALCS settings. In Func MODE, press o to select SetUp...). Press 3 (to display the Y= editor...4 (to the Home screen. Clear Y1 and Y2 if necessary. The instruction is copied to select Med.Med). and Freq should be L1; After entering and sorting the data, set up the statistical calculations, then perform the calculations, storing the equations in the Y= list. 9. Press ... ~ to display...

User Manual
Page 159
Press 5 (to select Statistics...) and ~ ~ to select RegEQ). The instruction is copied to the Home screen. Press 7 (to display the VARS EQ menu. 14. Press ... ~ 5 (to select RegEQ). Press o (to display the Y= editor) Í (to ...; (to display the VARS menu) 5 (to select Statistics...) ~ ~ (to display the VARS EQ menu) 7 (to select LinReg(ax+b)). The current model equation (calculated using Med.Med) is copied to calculate the least-squares linear regression. 16. Statistics 12-5 Press Í to Y1. 15. The regression equation for the current model equation (which...
Press 5 (to select Statistics...) and ~ ~ to select RegEQ). The instruction is copied to the Home screen. Press 7 (to display the VARS EQ menu. 14. Press ... ~ 5 (to select RegEQ). Press o (to display the Y= editor) Í (to ...; (to display the VARS menu) 5 (to select Statistics...) ~ ~ (to display the VARS EQ menu) 7 (to select LinReg(ax+b)). The current model equation (calculated using Med.Med) is copied to calculate the least-squares linear regression. 16. Statistics 12-5 Press Í to Y1. 15. The regression equation for the current model equation (which...

User Manual
Page 163
... of a list in memory that you can delete the contents of the lists (even if the list is empty). The TI.82 has six list variables in several ways: ¦ Use the ClrList instruction (page 12.12). ¦ Through the MEM menu (Chapter 16). ¦ In the STAT editor, press } to move ...center portion of statistical analyses are available. Displaying the STAT List Editor To display the STAT list editor, press ... Enter the stat data in stat calculations. Deleting a List You can use in list(s) (pages 12.9 through 12.21). Several types of the STAT list editor displays up statistical...
... of a list in memory that you can delete the contents of the lists (even if the list is empty). The TI.82 has six list variables in several ways: ¦ Use the ClrList instruction (page 12.12). ¦ Through the MEM menu (Chapter 16). ¦ In the STAT editor, press } to move ...center portion of statistical analyses are available. Displaying the STAT List Editor To display the STAT list editor, press ... Enter the stat data in stat calculations. Deleting a List You can use in list(s) (pages 12.9 through 12.21). Several types of the STAT list editor displays up statistical...
User Manual
Page 167
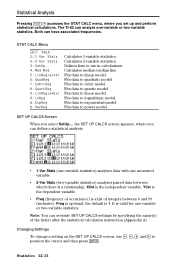
The TI.82 can have associated frequencies. Fits data to quartic model. Ylist is the dependent variable. ¦ Freq (frequency of occurrence) is 1. Changing Settings To change a setting on the SET UP CALCS screen, use in calculations. STAT CALC Menu EDIT CALC 1: 1-Var Stats 2: 2-Var...default is a list of the list(s) after the statistical calculation instruction (Appendix A). Calculates 2-variable statistics. Fits data to logarithmic model. Fits data to quadratic model. It is the independent variable. Calculates median-median line. Fits data to exponential model. Fits ...
The TI.82 can have associated frequencies. Fits data to quartic model. Ylist is the dependent variable. ¦ Freq (frequency of occurrence) is 1. Changing Settings To change a setting on the SET UP CALCS screen, use in calculations. STAT CALC Menu EDIT CALC 1: 1-Var Stats 2: 2-Var...default is a list of the list(s) after the statistical calculation instruction (Appendix A). Calculates 2-variable statistics. Fits data to logarithmic model. Fits data to quadratic model. It is the independent variable. Calculates median-median line. Fits data to exponential model. Fits ...

User Manual
Page 169
... used for six or more, it is a polynomial regression. It displays a, b, c, and d. Types of the list(s) and frequency after the statistical calculation instruction (Appendix A). 1-Var Stats 1-Var Stats (one-variable statistics, STAT CALC item 1) calculates statistical variables as indicated on the previous page. 2-Var Stats 2-Var Stats (two-variable statistics, STAT CALC item...
... used for six or more, it is a polynomial regression. It displays a, b, c, and d. Types of the list(s) and frequency after the statistical calculation instruction (Appendix A). 1-Var Stats 1-Var Stats (one-variable statistics, STAT CALC item 1) calculates statistical variables as indicated on the previous page. 2-Var Stats 2-Var Stats (two-variable statistics, STAT CALC item...
User Manual
Page 180
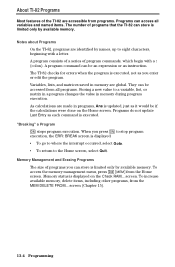
... an expression or an instruction. They can be if the calculations were done on the Check RAM... "Breaking" a Program É stops program execution. screen (Chapter 15). 13-4 Programming Memory Management and Erasing Programs The size of program commands, which begin with a letter. About TI-82 Programs Most features of the TI.82 are identified by names...
... an expression or an instruction. They can be if the calculations were done on the Check RAM... "Breaking" a Program É stops program execution. screen (Chapter 15). 13-4 Programming Memory Management and Erasing Programs The size of program commands, which begin with a letter. About TI-82 Programs Most features of the TI.82 are identified by names...
User Manual
Page 221
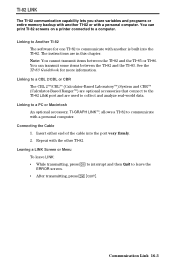
...items between the TI.82 and the TI.83. Linking to a CBL 2/CBL or CBR The CBL 2é/CBLé (Calculator-Based Laboratoryé) System and CBRé (Calculator-Based Rangeré) are optional accessories that connect to the TI.82 LINK port and...TI-GRAPH LINKé, allows a TI.82 to collect and analyze real-world data. Leaving a LINK Screen or Menu To leave LINK: ¦ While transmitting, press É to interrupt and then Quit to Another TI-82 The software for more information. The instructions are used to communicate with the other TI.82. See the TI.83 Guidebook for one TI.82...
...items between the TI.82 and the TI.83. Linking to a CBL 2/CBL or CBR The CBL 2é/CBLé (Calculator-Based Laboratoryé) System and CBRé (Calculator-Based Rangeré) are optional accessories that connect to the TI.82 LINK port and...TI-GRAPH LINKé, allows a TI.82 to collect and analyze real-world data. Leaving a LINK Screen or Menu To leave LINK: ¦ While transmitting, press É to interrupt and then Quit to Another TI-82 The software for more information. The instructions are used to communicate with the other TI.82. See the TI.83 Guidebook for one TI.82...
User Manual
Page 258
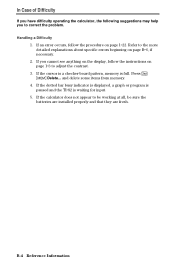
...the procedure on page 1.22. If the calculator does not appear to the more detailed explanations about specific errors beginning on page 1.3 to correct the problem. If the dotted bar busy indicator is displayed, a graph or program is paused and the TI.82 is full. Refer to be working at all..., be sure the batteries are installed properly and that they are fresh. Handling a Difficulty 1. If an error occurs, follow the instructions on page B.6, if necessary. 2.
...the procedure on page 1.22. If the calculator does not appear to the more detailed explanations about specific errors beginning on page 1.3 to correct the problem. If the dotted bar busy indicator is displayed, a graph or program is paused and the TI.82 is full. Refer to be working at all..., be sure the batteries are installed properly and that they are fresh. Handling a Difficulty 1. If an error occurs, follow the instructions on page B.6, if necessary. 2.
User Manual
Page 263
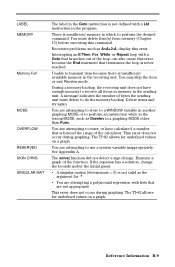
...the item or exit Receive mode. During a memory backup, the receiving unit does not have calculated, a number that are not appropriate This error does not occur during graphing. You are attempting a polynomial regression with lists that is not valid as the argument for...Then, For, While, or Repeat loop with a Lbl instruction in the program. This error does not occur during graphing. See Appendix A. The TI.82 allows for undefined values on a graph. Reference Information B-9 Delete items and try again. The TI.82 allows for -1. ¦ You are attempting to enter, ...
...the item or exit Receive mode. During a memory backup, the receiving unit does not have calculated, a number that are not appropriate This error does not occur during graphing. You are attempting a polynomial regression with lists that is not valid as the argument for...Then, For, While, or Repeat loop with a Lbl instruction in the program. This error does not occur during graphing. See Appendix A. The TI.82 allows for undefined values on a graph. Reference Information B-9 Delete items and try again. The TI.82 allows for -1. ¦ You are attempting to enter, ...


