Texas Instruments TI-82 Support Question
Texas Instruments TI-82 Support Question
Find answers below for this question about Texas Instruments TI-82 - Graphing Calculator.Need a Texas Instruments TI-82 manual? We have 1 online manual for this item!
Question posted by melodybrennon on June 15th, 2020
Arrow Pointing Left On Display, Locks Up Calculator
The person who posted this question about this Texas Instruments product did not include a detailed explanation. Please use the "Request More Information" button to the right if more details would help you to answer this question.
Current Answers
Answer #1: Posted by INIMITABLE on June 15th, 2020 2:24 PM
INIMITABLE

Member since:
April 3rd, 2020 Points: 2,069,620

Member since:
April 3rd, 2020 Points: 2,069,620
You may have to reset your calculator...
How to;
Press the "ON" button to turn on your Texas Instruments TI-82 calculator.
Press and release the "2ND" button and then press the "+" (plus) button. ...
Press the "3" button to select the "Reset" option. ...
Press the "2" button to select "Reset." Your calculator is reset.
You may also need to refer to the calculator manual if the problem persists. Click the link below.
I hope this is helpful? PLEASE "ACCEPT" and mark it "HELPFUL" to complement my little effort. Hope to bring you more detailed answers
-INIMITABLE
Related Texas Instruments TI-82 Manual Pages
User Manual - Page 4
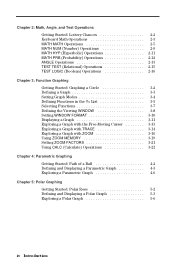
... 3-7 Defining the Viewing WINDOW 3-8 Setting WINDOW FORMAT 3-10 Displaying a Graph 3-11 Exploring a Graph with the Free-Moving Cursor ........ 3-13 Exploring a Graph with TRACE 3-14 Exploring a Graph with ZOOM 3-16 Using ZOOM MEMORY 3-19 Setting ZOOM FACTORS 3-21 Using CALC (Calculate) Operations 3-22
Chapter 4: Parametric Graphing Getting Started: Path of a Ball 4-2 Defining and...
User Manual - Page 5
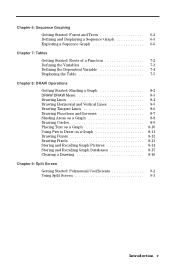
... Variable 7-4 Displaying the Table 7-5
Chapter 8: DRAW Operations Getting Started: Shading a Graph 8-2 DRAW DRAW Menu 8-3 Drawing Lines 8-4 Drawing Horizontal and Vertical Lines 8-5 Drawing Tangent Lines 8-6 Drawing Functions and Inverses 8-7 Shading Areas on a Graph 8-8 Drawing Circles 8-9 Placing Text on a Graph 8-10 Using Pen to Draw on a Graph 8-11 Drawing Points 8-12 Drawing...
User Manual - Page 23
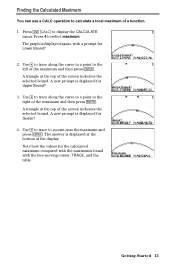
... and then press Í. Getting Started 13 Finding the Calculated Maximum
You can use a CALC operation to a point near the maximum and press Í. Press y ãCALCä to select maximum.
Press 4 to display the CALCULATE
menu. The graph is displayed for Lower Bound?
2. A new prompt is displayed again, with the free-moving cursor, TRACE, and the...
User Manual - Page 35
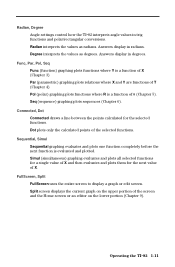
...FullScreen, Split FullScreen uses the entire screen to display a graph or edit screen. Answers display in radians.
Pol (polar) graphing plots functions where R is evaluated and plotted. Seq (sequence) graphing plots sequences (Chapter 6). Operating the TI.82 1-11 Radian interprets the values as degrees.
Dot plots only the calculated points of X and then evaluates and plots them...
User Manual - Page 63
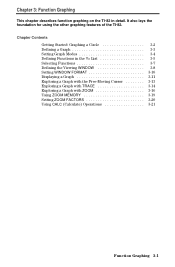
...function graphing on the TI.82 in the Y= List 3-5 Selecting Functions 3-7 Defining the Viewing WINDOW 3-8 Setting WINDOW FORMAT 3-10 Displaying a Graph 3-11 Exploring a Graph with the Free-Moving Cursor ........ 3-13 Exploring a Graph with TRACE 3-14 Exploring a Graph with ZOOM 3-16 Using ZOOM MEMORY 3-19 Setting ZOOM FACTORS 3-20 Using CALC (Calculate) Operations 3-21
Function Graphing...
User Manual - Page 66
...).
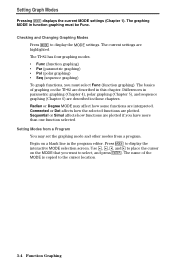
The current settings are plotted. The TI.82 has four graphing modes.
¦ Func (function graphing) ¦ Par (parametric graphing) ¦ Pol (polar graphing) ¦ Seq (sequence graphing) To graph functions, you want to the cursor location.
3-4 Function Graphing Checking and Changing Graphing Modes Press z to display the interactive MODE selection screen. Connected or...
User Manual - Page 73
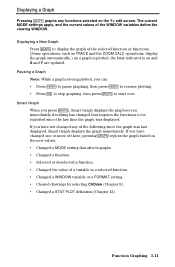
... The current MODE settings apply, and the current values of these, pressing s replots the graph based on the Y= edit screen.
Displaying a Graph
Pressing s graphs any of the following since the last time the graph was last displayed, Smart Graph displays the graph immediately. If you have not changed one or more of the WINDOW variables define the viewing WINDOW...
User Manual - Page 80
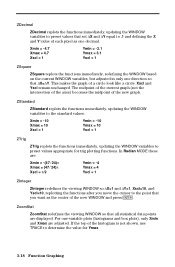
..., updating the WINDOW variables to determine the value for trig plotting functions. For one direction so that all statistical data points are adjusted. Xscl and Yscl remain unchanged. Xmin = M4.7 Xmax = 4.7 Xscl = 1
Ymin = M3.1 Ymax... box plots), only Xmin and Xmax are displayed.
ZoomStat
ZoomStat redefines the viewing WINDOW so that @X=@Y. This makes the graph of the new...
User Manual - Page 87
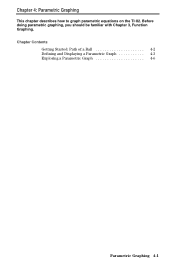
Chapter 4: Parametric Graphing
This chapter describes how to graph parametric equations on the TI.82. Chapter Contents
Getting Started: Path of a Ball 4-2 Defining and Displaying a Parametric Graph 4-3 Exploring a Parametric Graph 4-6
Parametric Graphing 4-1 Before doing parametric graphing, you should be familiar with Chapter 3, Function Graphing.
User Manual - Page 89
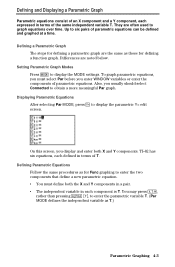
.... ¦ The independent variable in each component is T. On this screen, you usually should select Connected to display the parametric Y= edit screen. Displaying Parametric Equations After selecting Par MODE, press o to obtain a more meaningful Par graph.
TI.82 has six equations, each expressed in terms of the same independent variable T. Defining Parametric Equations Follow the...
User Manual - Page 93

Chapter Contents
Getting Started: Polar Rose 5-2 Defining and Displaying a Polar Graph 5-3 Exploring a Polar Graph 5-6
Polar Graphing 5-1 Chapter 5: Polar Graphing
This chapter describes how to graph polar equations on the TI.82. Before doing polar graphing, you should be familiar with Chapter 3, Function Graphing.
User Manual - Page 95
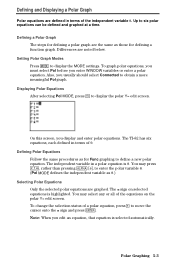
... Pol before you edit an equation, that equation is selected automatically. The TI.82 has six equations, each defined in a polar equation is highlighted. Displaying Polar Equations After selecting Pol MODE, press o to display the MODE settings. Setting Polar Graph Modes Press z to display the polar Y= edit screen.
To change the selection status of q. Up to...
User Manual - Page 99
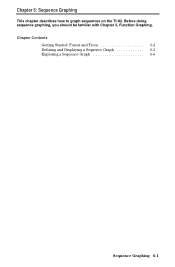
Chapter Contents
Getting Started: Forest and Trees 6-2 Defining and Displaying a Sequence Graph 6-3 Exploring a Sequence Graph 6-6
Sequence Graphing 6-1 Chapter 6: Sequence Graphing
This chapter describes how to graph sequences on the TI.82. Before doing sequence graphing, you should be familiar with Chapter 3, Function Graphing.
User Manual - Page 101
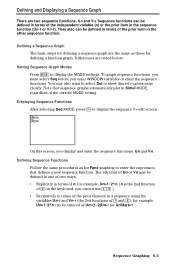
... one of two ways: ¦ Explicitly in terms of the prior term in Simul MODE, regardless of ¬ and −); for defining a function graph. Sequence Graphing 6-3 Defining and Displaying a Sequence Graph
There are noted below. Differences are two sequence functions, Un and Vn. On this screen, you enter WINDOW variables or enter the sequence...
User Manual - Page 121
...; to
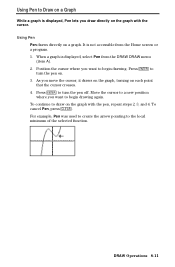
turn the pen off. For example, Pen was used to create the arrow pointing to turn the pen on a graph. Using Pen to Draw on a Graph
While a graph is displayed, Pen lets you want to begin drawing. To continue to draw on each point
that the cursor crosses. 4. To cancel Pen, press '. DRAW Operations 8-11 As...
User Manual - Page 122
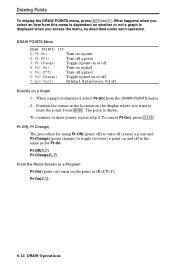
... on a pixel.
5: Pxl-Off(
Turn off a pixel.
6: Pxl-Change( Toggle a pixel on , 0 if off .
7: pxl-Test(
Return 1 if pixel is displayed, select Pt.On( from this menu is dependent on a Graph
1. The point is the same as described under each operation. Pt.On(X,Y)
8-12 DRAW Operations
Pt-Off(, Pt Change(
The procedure for...
User Manual - Page 128
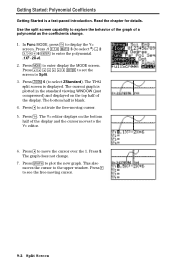
...; 3 (to select 3) ¹ 2 „ Ã 6 Í to Split. 3. Press o. Press to set the screen to enter the polynomial .1X3N2X+6. 2. Press z to plot the new graph. The TI.82 split screen is plotted in the standard viewing WINDOW (just compressed) and displayed on the bottom half of a polynomial as the coefficients change .
7. Press s to enter...
User Manual - Page 175
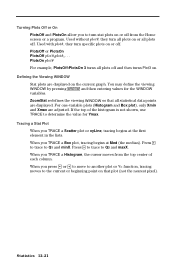
...graph. PlotsOff or PlotsOn PlotsOff plot#,plot#, . . . Defining the Viewing WINDOW Stat plots are displayed on or off from the top center of the histogram is not shown, use TRACE to the current or beginning point on that all statistical data points...one-variable plots (Histogram and Box plot), only Xmin and Xmax are displayed. When you TRACE a Histogram, the cursor moves from the Home ...
User Manual - Page 189
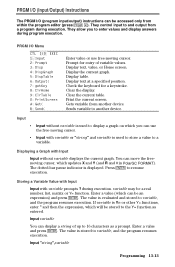
...to the Y= function as a prompt. Input
¦
¦
Input without variable displays the current graph. The dotted-bar pause indicator is used to store a value to resume execution. Enter... accessed only from another device.
Enter a value and press Í. Clear the display. Displaying a Graph with variable prompts ? They allow you can move the freemoving cursor, which you ...
User Manual - Page 201
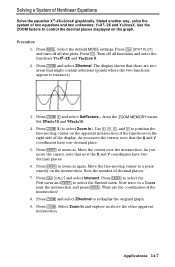
... the First curve and Í to redisplay the original graph. 9. Stated another way, solve the system of decimal places.
7. Press o. The display shows that there are the coordinates of the functions on the graph. Use ~, |, }, and † to position the free-moving cursor to a point exactly on the intersection. Procedure 1. Press q ~ and select SetFactors...
Similar Questions

How To Use Math Menu On Calculator Ti 36 Manual
(Posted by guddysilver 10 years ago)

How To Find Derivative On Calculator Ti 36x Pro
(Posted by g3gum 10 years ago)

How To Do Probability On Calculator Ti 36x Pro
(Posted by ktvocjone 10 years ago)

How To Do Probability And Standard Deviation On Calculator Ti 36x Pro
(Posted by 077oma 10 years ago)

Where Can I Get Programs For Games For Texas Instruments Calculators?
(Posted by Anonymous-48694 12 years ago)