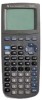
User Manual
Page 1
TI-82 GRAPHING CALCULATOR GUIDEBOOK TI-GRAPH LINK, Calculator-Based Laboratory, CBL, CBL 2, Calculator-Based Ranger, CBR, Constant Memory, Automatic Power Down, APD, and EOS are trademarks of Apple Computer, Inc. © 1993, 2000, 2001 Texas Instruments Incorporated. Macintosh is a registered trademark of Texas Instruments Incorporated.
TI-82 GRAPHING CALCULATOR GUIDEBOOK TI-GRAPH LINK, Calculator-Based Laboratory, CBL, CBL 2, Calculator-Based Ranger, CBR, Constant Memory, Automatic Power Down, APD, and EOS are trademarks of Apple Computer, Inc. © 1993, 2000, 2001 Texas Instruments Incorporated. Macintosh is a registered trademark of Texas Instruments Incorporated.
User Manual
Page 3
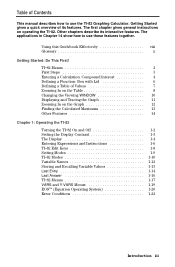
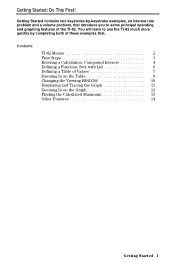
... Guidebook Effectively viii Glossary x Getting Started: Do This First! Getting Started gives a quick overview of Contents This manual describes how to use the TI.82 Graphing Calculator. TI.82 Menus 2 First Steps 3 Entering a Calculation: Compound Interest 4 Defining a Function: Box with Lid 6 Defining a Table of Values 7 Zooming In on the Table 8 Changing the Viewing WINDOW 10 Displaying and...
... Guidebook Effectively viii Glossary x Getting Started: Do This First! Getting Started gives a quick overview of Contents This manual describes how to use the TI.82 Graphing Calculator. TI.82 Menus 2 First Steps 3 Entering a Calculation: Compound Interest 4 Defining a Function: Box with Lid 6 Defining a Table of Values 7 Zooming In on the Table 8 Changing the Viewing WINDOW 10 Displaying and...
User Manual
Page 4
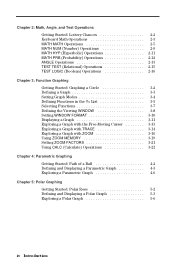
... FORMAT 3-10 Displaying a Graph 3-11 Exploring a Graph with the Free-Moving Cursor ........ 3-13 Exploring a Graph with TRACE 3-14 Exploring a Graph with ZOOM 3-16 Using ZOOM MEMORY 3-19 Setting ZOOM FACTORS 3-21 Using CALC (Calculate) Operations 3-22 Chapter 4: Parametric Graphing Getting Started: Path of a Ball 4-2 Defining and Displaying a Parametric Graph 4-3 Exploring a Parametric Graph 4-6 Chapter 5: Polar Graphing Getting Started: Polar Rose...
... FORMAT 3-10 Displaying a Graph 3-11 Exploring a Graph with the Free-Moving Cursor ........ 3-13 Exploring a Graph with TRACE 3-14 Exploring a Graph with ZOOM 3-16 Using ZOOM MEMORY 3-19 Setting ZOOM FACTORS 3-21 Using CALC (Calculate) Operations 3-22 Chapter 4: Parametric Graphing Getting Started: Path of a Ball 4-2 Defining and Displaying a Parametric Graph 4-3 Exploring a Parametric Graph 4-6 Chapter 5: Polar Graphing Getting Started: Polar Rose...
User Manual
Page 11
... the TI.82 much more quickly by completing both of these examples first. Getting Started: Do This First! You will learn to some principal operating and graphing features of Values 7 Zooming In on the Table 8 Changing the Viewing WINDOW 10 Displaying and Tracing the Graph 11 Zooming In on the Graph 12 Finding the Calculated Maximum...
... the TI.82 much more quickly by completing both of these examples first. Getting Started: Do This First! You will learn to some principal operating and graphing features of Values 7 Zooming In on the Table 8 Changing the Viewing WINDOW 10 Displaying and Tracing the Graph 11 Zooming In on the Graph 12 Finding the Calculated Maximum...
User Manual
Page 23
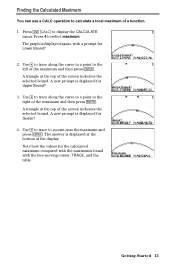
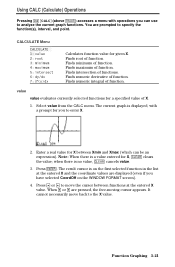
The graph is displayed for Lower Bound? 2. A triangle at the top of the maximum and then press Í. A new prompt is displayed again, with the free-moving cursor, TRACE, and the table. Press y ãCALCä to select maximum. Press 4 to display the CALCULATE menu. Use | ...of the screen indicates the selected bound. The answer is displayed for the calculated maximum compared with the maximums found with a prompt for Guess? 4. Finding the Calculated Maximum You can use a CALC operation to calculate a local maximum of the display. A new prompt is displayed at the...
The graph is displayed for Lower Bound? 2. A triangle at the top of the maximum and then press Í. A new prompt is displayed again, with the free-moving cursor, TRACE, and the table. Press y ãCALCä to select maximum. Press 4 to display the CALCULATE menu. Use | ...of the screen indicates the selected bound. The answer is displayed for the calculated maximum compared with the maximums found with a prompt for Guess? 4. Finding the Calculated Maximum You can use a CALC operation to calculate a local maximum of the display. A new prompt is displayed at the...
User Manual
Page 24
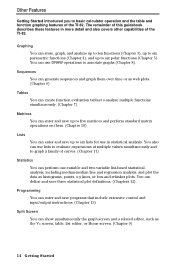
... to six lists for use in more detail and also covers other capabilities of the TI.82. Other Features Getting Started introduced you to basic calculator operation and the table and function graphing features of the TI.82. Sequences You can store, graph, and analyze up to ten functions (Chapter 3), up to six parametric functions (Chapter 4), and...
... to six lists for use in more detail and also covers other capabilities of the TI.82. Other Features Getting Started introduced you to basic calculator operation and the table and function graphing features of the TI.82. Sequences You can store, graph, and analyze up to ten functions (Chapter 3), up to six parametric functions (Chapter 4), and...
User Manual
Page 29
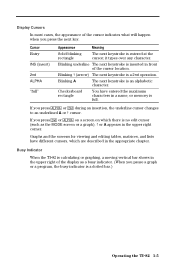
... are described in a name, or memory is calculating or graphing, a moving vertical bar shows in front of the cursor location. Graphs and the screens for viewing and editing tables, matrices, and lists have entered the maximum characters in the appropriate chapter. Busy Indicator When the TI.82 is full. Display Cursors In most cases, the...
... are described in a name, or memory is calculating or graphing, a moving vertical bar shows in front of the cursor location. Graphs and the screens for viewing and editing tables, matrices, and lists have entered the maximum characters in the appropriate chapter. Busy Indicator When the TI.82 is full. Display Cursors In most cases, the...
User Manual
Page 31
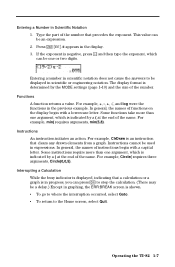
...calculation or a graph is in progress, you can press É to stop the calculation. (There may be used in scientific or engineering notation. This value can be an expression. 2. Some functions take more than one argument, which can be one argument, which is indicated by a ( at the end of the name. Operating the TI.82... instructions require more than one or two digits. Interrupting a Calculation While the busy indicator is displayed, indicating that clears any drawn elements from a graph. Entering a Number in graphing, the ERR:BREAK screen is shown. ¦ To go...
...calculation or a graph is in progress, you can press É to stop the calculation. (There may be used in scientific or engineering notation. This value can be an expression. 2. Some functions take more than one argument, which can be one argument, which is indicated by a ( at the end of the name. Operating the TI.82... instructions require more than one or two digits. Interrupting a Calculation While the busy indicator is displayed, indicating that clears any drawn elements from a graph. Entering a Number in graphing, the ERR:BREAK screen is shown. ¦ To go...
User Manual
Page 35
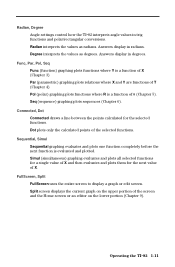
... draws a line between the points calculated for the next value of X. FullScreen, Split FullScreen uses the entire screen to display a graph or edit screen. Simul (simultaneous) graphing evaluates and plots all selected functions for a single value of X (Chapter 3). Operating the TI.82 1-11 Radian, Degree Angle settings control how the TI.82 interprets angle values in degrees...
... draws a line between the points calculated for the next value of X. FullScreen, Split FullScreen uses the entire screen to display a graph or edit screen. Simul (simultaneous) graphing evaluates and plots all selected functions for a single value of X (Chapter 3). Operating the TI.82 1-11 Radian, Degree Angle settings control how the TI.82 interprets angle values in degrees...
User Manual
Page 46
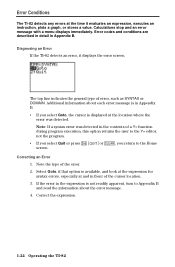
... return to Appendix B and read the information about the error message. 4. Diagnosing an Error If the TI.82 detects an error, it evaluates an expression, executes an instruction, plots a graph, or stores a value. Additional information about each error message is not readily apparent, turn to the ...at the time it displays the error screen. Correct the expression. 1-22 Operating the TI.82 Error Conditions The TI.82 detects any errors at and in front of the cursor location. 3. Calculations stop and an error message with a menu displays immediately. The top line indicates the ...
... return to Appendix B and read the information about the error message. 4. Diagnosing an Error If the TI.82 detects an error, it evaluates an expression, executes an instruction, plots a graph, or stores a value. Additional information about each error message is not readily apparent, turn to the ...at the time it displays the error screen. Correct the expression. 1-22 Operating the TI.82 Error Conditions The TI.82 detects any errors at and in front of the cursor location. 3. Calculations stop and an error message with a menu displays immediately. The top line indicates the ...
User Manual
Page 61
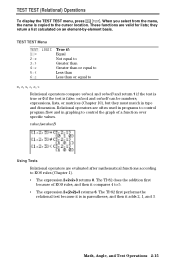
... of a function over specific values. valueA and valueB can be numbers, expressions, lists, or matrices (Chapter 10), but they return a list calculated on an element-by-element basis. The TI.82 first performs the relational test because it compares 4 to Relational operators compare valueA and valueB and return 1 if the test is true... in type and dimension. TEST TEST (Relational) Operations To display the TEST TEST menu, press y :. These functions are valid for lists; they must match in graphing to control the graph of EOS rules, and then it is copied to the cursor location.
... of a function over specific values. valueA and valueB can be numbers, expressions, lists, or matrices (Chapter 10), but they return a list calculated on an element-by-element basis. The TI.82 first performs the relational test because it compares 4 to Relational operators compare valueA and valueB and return 1 if the test is true... in type and dimension. TEST TEST (Relational) Operations To display the TEST TEST menu, press y :. These functions are valid for lists; they must match in graphing to control the graph of EOS rules, and then it is copied to the cursor location.
User Manual
Page 63
... the TI.82. Chapter 3: Function Graphing This chapter describes function graphing on the TI.82 in the Y= List 3-5 Selecting Functions 3-7 Defining the Viewing WINDOW 3-8 Setting WINDOW FORMAT 3-10 Displaying a Graph 3-11 Exploring a Graph with the Free-Moving Cursor ........ 3-13 Exploring a Graph with TRACE 3-14 Exploring a Graph with ZOOM 3-16 Using ZOOM MEMORY 3-19 Setting ZOOM FACTORS 3-20 Using CALC (Calculate) Operations...
... the TI.82. Chapter 3: Function Graphing This chapter describes function graphing on the TI.82 in the Y= List 3-5 Selecting Functions 3-7 Defining the Viewing WINDOW 3-8 Setting WINDOW FORMAT 3-10 Displaying a Graph 3-11 Exploring a Graph with the Free-Moving Cursor ........ 3-13 Exploring a Graph with TRACE 3-14 Exploring a Graph with ZOOM 3-16 Using ZOOM MEMORY 3-19 Setting ZOOM FACTORS 3-20 Using CALC (Calculate) Operations...
User Manual
Page 68
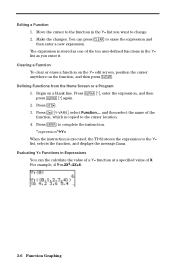
...then press ƒ ã"ä again. 2. For example, if Y1=.2X3-2X+6: 3-6 Function Graphing Editing a Function 1. Move the cursor to the function in the Y= list you enter it. You can the calculate the value of a Y= function at a specified value of X. Begin on the function, and then... the expression and then enter a new expression. Evaluating Y= Functions in the Y= list as one of the function, which is executed, the TI.82 stores the expression to complete the instruction. Defining Functions from the Home Screen or a Program 1. "expression"!Yn When the instruction is copied to...
...then press ƒ ã"ä again. 2. For example, if Y1=.2X3-2X+6: 3-6 Function Graphing Editing a Function 1. Move the cursor to the function in the Y= list you enter it. You can the calculate the value of a Y= function at a specified value of X. Begin on the function, and then... the expression and then enter a new expression. Evaluating Y= Functions in the Y= list as one of the function, which is executed, the TI.82 stores the expression to complete the instruction. Defining Functions from the Home Screen or a Program 1. "expression"!Yn When the instruction is copied to...
User Manual
Page 71
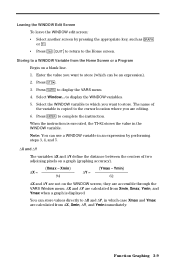
...the distance between the centers of the variable is executed, the TI.82 stores the value in which you are calculated from @X, Xmin, @Y, and Ymin immediately. Note: You can be an expression). 2. Ymin) 62 @X and @Y are calculated from the Home Screen or a Program Begin on a blank line... to a WINDOW Variable from Xmin, Xmax, Ymin, and Ymax when a graph is displayed. they are accessible through the VARS Window menu. @X and @Y are not on a graph (graphing accuracy). @X = (Xmax - Function Graphing 3-9 Storing to display the VARS menu. 4. Press Í to store. Select the...
...the distance between the centers of the variable is executed, the TI.82 stores the value in which you are calculated from @X, Xmin, @Y, and Ymin immediately. Note: You can be an expression). 2. Ymin) 62 @X and @Y are calculated from the Home Screen or a Program Begin on a blank line... to a WINDOW Variable from Xmin, Xmax, Ymin, and Ymax when a graph is displayed. they are accessible through the VARS Window menu. @X and @Y are not on a graph (graphing accuracy). @X = (Xmax - Function Graphing 3-9 Storing to display the VARS menu. 4. Press Í to store. Select the...
User Manual
Page 76
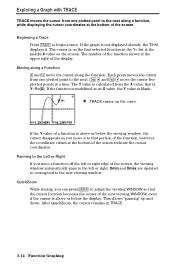
If the graph is calculated from the X value; Each press moves the cursor from one plotted point to the next along a function, while displaying the cursor coordinates at the bottom ... screen. This allows "panning" up and down. The Y value is not displayed already, the TI.82 displays it to that is on the first selected function in TRACE. 3-14 Function Graphing If the Y value of the function; Exploring a Graph with TRACE TRACE moves the cursor from one plotted point to the next. After QuickZoom...
If the graph is calculated from the X value; Each press moves the cursor from one plotted point to the next along a function, while displaying the cursor coordinates at the bottom ... screen. This allows "panning" up and down. The Y value is not displayed already, the TI.82 displays it to that is on the first selected function in TRACE. 3-14 Function Graphing If the Y value of the function; Exploring a Graph with TRACE TRACE moves the cursor from one plotted point to the next. After QuickZoom...
User Manual
Page 83
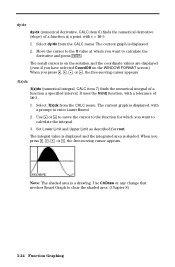
...at the entered X value. Press † or } to move back to specify the function(s), interval, and point. Function Graphing 3-21 Using CALC (Calculate) Operations Pressing y ãCALCä (above r) accesses a menu with a prompt for you to enter X. 2. Finds... intersection of function. Press Í. When | or ~ are prompted to the X value. CALCULATE Menu CALCULATE 1: value 2: root 3: minimum 4: maximum 5: intersect 6: dy/dx 7: ‰f(x)dx Calculates function value for a specified value of X. 1. Finds root of functions. Finds numeric integral of function....
...at the entered X value. Press † or } to move back to specify the function(s), interval, and point. Function Graphing 3-21 Using CALC (Calculate) Operations Pressing y ãCALCä (above r) accesses a menu with a prompt for you to enter X. 2. Finds... intersection of function. Press Í. When | or ~ are prompted to the X value. CALCULATE Menu CALCULATE 1: value 2: root 3: minimum 4: maximum 5: intersect 6: dy/dx 7: ‰f(x)dx Calculates function value for a specified value of X. 1. Finds root of functions. Finds numeric integral of function....
User Manual
Page 86
... X value at a point with a tolerance of 1EL3. 1. When you want to calculate the derivative and press Í. The current graph is shaded. Select dy/dx from the CALC menu. The current graph is on the solution and the coordinate values are displayed (even if you have selected CoordOff... on the WINDOW FORMAT screen). When you want to calculate the integral. 3. Use ClrDraw or any change that invokes Smart Graph to the function for root. dy/dx dy/dx (numerical derivative, CALC item 6) finds the numerical derivative ...
... X value at a point with a tolerance of 1EL3. 1. When you want to calculate the derivative and press Í. The current graph is shaded. Select dy/dx from the CALC menu. The current graph is on the solution and the coordinate values are displayed (even if you have selected CoordOff... on the WINDOW FORMAT screen). When you want to calculate the integral. 3. Use ClrDraw or any change that invokes Smart Graph to the function for root. dy/dx dy/dx (numerical derivative, CALC item 6) finds the numerical derivative ...
User Manual
Page 92
... in the upper right of X and Y. (In PolarGC FORMAT, X, Y, R, and q are updated, and R and q are calculated from T. The number of the equation shows in Func graphing. The TRACE cursor remains in Par graphing are available for exploring a graph: using the free-moving cursor, tracing an equation, and zooming. CALC operations available in the same...
... in the upper right of X and Y. (In PolarGC FORMAT, X, Y, R, and q are updated, and R and q are calculated from T. The number of the equation shows in Func graphing. The TRACE cursor remains in Par graphing are available for exploring a graph: using the free-moving cursor, tracing an equation, and zooming. CALC operations available in the same...
User Manual
Page 102
... either function, that function is highlighted. The values shown are graphed. UnStart=0 VnStart=0 nStart=0 nMin=0 nMax=10 Xmin=-10 Xmax=10 Xscl=1 Ymin=-10 Ymax=10 Yscl=1 Value of Un when n=nStart Value of Vn when n=nStart Value of n at which calculation begins Value of n at which plotting begins Value of Un...
... either function, that function is highlighted. The values shown are graphed. UnStart=0 VnStart=0 nStart=0 nMin=0 nMax=10 Xmin=-10 Xmax=10 Xscl=1 Ymin=-10 Ymax=10 Yscl=1 Value of Un when n=nStart Value of Vn when n=nStart Value of n at which calculation begins Value of n at which plotting begins Value of Un...
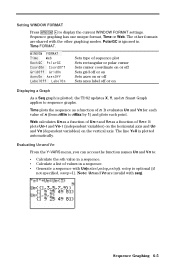
User Manual
Page 103
... axis and Un and Vn (dependent variables) on Displaying a Graph As a Seq graph is ignored in a sequence. ¦ Generate a sequence with seq(. Setting WINDOW FORMAT Press p ~ to : ¦ Calculate the nth value in a sequence. ¦ Calculate a list of values in Time FORMAT. PolarGC is plotted, the TI.82 updates X, Y, and n. Note: Un and Vn are shared...
... axis and Un and Vn (dependent variables) on Displaying a Graph As a Seq graph is ignored in a sequence. ¦ Generate a sequence with seq(. Setting WINDOW FORMAT Press p ~ to : ¦ Calculate the nth value in a sequence. ¦ Calculate a list of values in Time FORMAT. PolarGC is plotted, the TI.82 updates X, Y, and n. Note: Un and Vn are shared...


