User Manual
Page 1
Macintosh is a registered trademark of Texas Instruments Incorporated. TI-82 GRAPHING CALCULATOR GUIDEBOOK TI-GRAPH LINK, Calculator-Based Laboratory, CBL, CBL 2, Calculator-Based Ranger, CBR, Constant Memory, Automatic Power Down, APD, and EOS are trademarks of Apple Computer, Inc. © 1993, 2000, 2001 Texas Instruments Incorporated.
Macintosh is a registered trademark of Texas Instruments Incorporated. TI-82 GRAPHING CALCULATOR GUIDEBOOK TI-GRAPH LINK, Calculator-Based Laboratory, CBL, CBL 2, Calculator-Based Ranger, CBR, Constant Memory, Automatic Power Down, APD, and EOS are trademarks of Apple Computer, Inc. © 1993, 2000, 2001 Texas Instruments Incorporated.
User Manual
Page 3
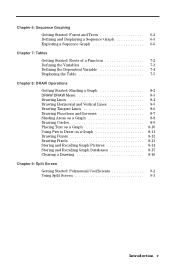
... its features. The first chapter gives general instructions on the Graph 12 Finding the Calculated Maximum 13 Other Features 14 Chapter 1: Operating the TI.82 Turning the TI.82 On and Off 1-2 Setting the Display Contrast 1-3 The Display 1-4 Entering Expressions and Instructions 1-6 TI.82 Edit Keys 1-8 Setting Modes 1-9 TI.82 Modes 1-10 Variable Names 1-12 Storing and Recalling Variable Values...
... its features. The first chapter gives general instructions on the Graph 12 Finding the Calculated Maximum 13 Other Features 14 Chapter 1: Operating the TI.82 Turning the TI.82 On and Off 1-2 Setting the Display Contrast 1-3 The Display 1-4 Entering Expressions and Instructions 1-6 TI.82 Edit Keys 1-8 Setting Modes 1-9 TI.82 Modes 1-10 Variable Names 1-12 Storing and Recalling Variable Values...
User Manual
Page 4
... FORMAT 3-10 Displaying a Graph 3-11 Exploring a Graph with the Free-Moving Cursor ........ 3-13 Exploring a Graph with TRACE 3-14 Exploring a Graph with ZOOM 3-16 Using ZOOM MEMORY 3-19 Setting ZOOM FACTORS 3-21 Using CALC (Calculate) Operations 3-22 Chapter 4: Parametric Graphing Getting Started: Path of a Ball 4-2 Defining and Displaying a Parametric Graph 4-3 Exploring a Parametric Graph 4-6 Chapter 5: Polar Graphing Getting Started: Polar Rose...
... FORMAT 3-10 Displaying a Graph 3-11 Exploring a Graph with the Free-Moving Cursor ........ 3-13 Exploring a Graph with TRACE 3-14 Exploring a Graph with ZOOM 3-16 Using ZOOM MEMORY 3-19 Setting ZOOM FACTORS 3-21 Using CALC (Calculate) Operations 3-22 Chapter 4: Parametric Graphing Getting Started: Path of a Ball 4-2 Defining and Displaying a Parametric Graph 4-3 Exploring a Parametric Graph 4-6 Chapter 5: Polar Graphing Getting Started: Polar Rose...
User Manual
Page 5
... Vertical Lines 8-5 Drawing Tangent Lines 8-6 Drawing Functions and Inverses 8-7 Shading Areas on a Graph 8-8 Drawing Circles 8-9 Placing Text on a Graph 8-10 Using Pen to Draw on a Graph 8-11 Drawing Points 8-12 Drawing Pixels 8-13 Storing and Recalling Graph Pictures 8-14 Storing and Recalling Graph Databases 8-15 Clearing a Drawing 8-16 Chapter 9: Split Screen Getting Started: Polynomial Coefficients...
... Vertical Lines 8-5 Drawing Tangent Lines 8-6 Drawing Functions and Inverses 8-7 Shading Areas on a Graph 8-8 Drawing Circles 8-9 Placing Text on a Graph 8-10 Using Pen to Draw on a Graph 8-11 Drawing Points 8-12 Drawing Pixels 8-13 Storing and Recalling Graph Pictures 8-14 Storing and Recalling Graph Databases 8-15 Clearing a Drawing 8-16 Chapter 9: Split Screen Getting Started: Polynomial Coefficients...
User Manual
Page 7
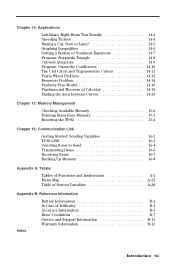
Chapter 14: Applications Left-Brain, Right-Brain Test Results 14-2 Speeding Tickets 14-4 Buying a Car, Now or Later 14-5 Graphing Inequalities 14-6 Solving a System of Nonlinear Equations 14-7 Program: Sierpinski Triangle 14-8 Cobweb Attractors 14-9 Program: Guess the ...Curves 14-20 Chapter 15: Memory Management Checking Available Memory 15-2 Deleting Items from Memory 15-3 Resetting the TI.82 15-4 Chapter 16: Communication Link Getting Started: Sending Variables 16-2 TI.82 LINK 16-3 Selecting Items to Send 16-4 Transmitting Items 16-6 Receiving Items 16-7 Backing Up Memory 16-8...
Chapter 14: Applications Left-Brain, Right-Brain Test Results 14-2 Speeding Tickets 14-4 Buying a Car, Now or Later 14-5 Graphing Inequalities 14-6 Solving a System of Nonlinear Equations 14-7 Program: Sierpinski Triangle 14-8 Cobweb Attractors 14-9 Program: Guess the ...Curves 14-20 Chapter 15: Memory Management Checking Available Memory 15-2 Deleting Items from Memory 15-3 Resetting the TI.82 15-4 Chapter 16: Communication Link Getting Started: Sending Variables 16-2 TI.82 LINK 16-3 Selecting Items to Send 16-4 Transmitting Items 16-6 Receiving Items 16-7 Backing Up Memory 16-8...

User Manual
Page 10
...and WINDOW settings. Menu items are shown on the TI.82 display. The TI.82 display is composed of a graph display, excluding cursor coordinates, axis labels, tick marks, and prompts. A function, which may be superimposed on which the TI.82 can be saved as graphing a family of curves, evaluating a function at multiple ...an expression. The Home Screen is a set of values that the TI.82 can use for important terms that can be evaluated to recreate the graph later. A list is the primary screen of the TI.82, where expressions can be entered and evaluated and instructions can be entered...
...and WINDOW settings. Menu items are shown on the TI.82 display. The TI.82 display is composed of a graph display, excluding cursor coordinates, axis labels, tick marks, and prompts. A function, which may be superimposed on which the TI.82 can be saved as graphing a family of curves, evaluating a function at multiple ...an expression. The Home Screen is a set of values that the TI.82 can use for important terms that can be evaluated to recreate the graph later. A list is the primary screen of the TI.82, where expressions can be entered and evaluated and instructions can be entered...
User Manual
Page 11
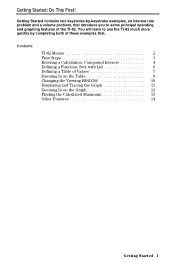
... more quickly by -keystroke examples, an interest rate problem and a volume problem, that introduce you to some principal operating and graphing features of the TI.82. Contents TI.82 Menus 2 First Steps 3 Entering a Calculation: Compound Interest .......... 4 Defining a Function: Box with Lid 6 Defining a Table of these examples first. Getting Started contains two keystroke-by completing both of...
... more quickly by -keystroke examples, an interest rate problem and a volume problem, that introduce you to some principal operating and graphing features of the TI.82. Contents TI.82 Menus 2 First Steps 3 Entering a Calculation: Compound Interest .......... 4 Defining a Function: Box with Lid 6 Defining a Table of these examples first. Getting Started contains two keystroke-by completing both of...

User Manual
Page 16
... Press y ãQuitä ' to return to determine the solution. B XB L 5. rectangles from two corners and X-by-125 mm. Use tables and graphs to the Home screen and clear it. 3. Press 200 ¿ ƒ W y ã:ä 250 ¿ ƒ L Í to store the...215;250 mm. From the diagram: 2X + A = W 2X + 2B = L V = A B X Substituting: V = (W - 2X) (L à 2 - Enter the function for tables and graphing on the Y= edit screen. Press z † Í to change the MODE back to define function Y1 in this screen. Defining a Function: Box with lid. X) X X WA...
... Press y ãQuitä ' to return to determine the solution. B XB L 5. rectangles from two corners and X-by-125 mm. Use tables and graphs to the Home screen and clear it. 3. Press 200 ¿ ƒ W y ã:ä 250 ¿ ƒ L Í to store the...215;250 mm. From the diagram: 2X + A = W 2X + 2B = L V = A B X Substituting: V = (W - 2X) (L à 2 - Enter the function for tables and graphing on the Y= edit screen. Press z † Í to change the MODE back to define function Y1 in this screen. Defining a Function: Box with lid. X) X X WA...

User Manual
Page 21
... be a maximum "in between" pixels.) Getting Started 11 Use the cursor-keys (|, ~, }, and †) to position the free-moving graph cursor just to the right of the center of the graph cursor. 3. Press | and ~ until you are updated continually with TRACE. 1. The TRACE cursor appears on the Y1 function near the... bottom line of the display shows the X and Y coordinate values for the X pixels. (There may be graphed and the WINDOW in which to graph it, you can trace along Y1, one X dot at a time, evaluating Y1 at the apparent maximum of Y1=(W-2X)(Là2-X)X is on the maximum Y ...
... be a maximum "in between" pixels.) Getting Started 11 Use the cursor-keys (|, ~, }, and †) to position the free-moving graph cursor just to the right of the center of the graph cursor. 3. Press | and ~ until you are updated continually with TRACE. 1. The TRACE cursor appears on the Y1 function near the... bottom line of the display shows the X and Y coordinate values for the X pixels. (There may be graphed and the WINDOW in which to graph it, you can trace along Y1, one X dot at a time, evaluating Y1 at the apparent maximum of Y1=(W-2X)(Là2-X)X is on the maximum Y ...
User Manual
Page 22
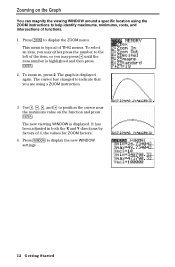
... of TI.82 menus. To zoom in both the X and Y directions by factors of functions. 1. The new viewing WINDOW is displayed again. Press p to display the ZOOM menu. It has been adjusted in , press 2. Press q to display the new WINDOW settings. 12 Getting Started The graph is displayed... the number to the left of the item, or you are using the ZOOM instructions to position the cursor near the maximum value on the Graph You can magnify the viewing WINDOW around a specific location using a ZOOM instruction. 3. Use |, }, ~, and † to help identify maximums, minimums, roots...
... of TI.82 menus. To zoom in both the X and Y directions by factors of functions. 1. The new viewing WINDOW is displayed again. Press p to display the ZOOM menu. It has been adjusted in , press 2. Press q to display the new WINDOW settings. 12 Getting Started The graph is displayed... the number to the left of the item, or you are using the ZOOM instructions to position the cursor near the maximum value on the Graph You can magnify the viewing WINDOW around a specific location using a ZOOM instruction. 3. Use |, }, ~, and † to help identify maximums, minimums, roots...
User Manual
Page 23
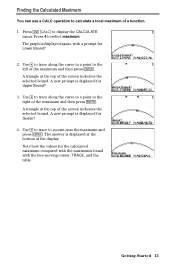
... the left of the display. Getting Started 13 A new prompt is displayed for Guess? 4. A new prompt is displayed for Lower Bound? 2. The graph is displayed at the bottom of the maximum and then press Í. A triangle at the top of the screen indicates the selected bound. Use | ...to trace to display the CALCULATE menu. Note how the values for the calculated maximum compared with the maximums found with a prompt for Upper Bound? 3. A triangle at the top of the screen indicates ...
... the left of the display. Getting Started 13 A new prompt is displayed for Guess? 4. A new prompt is displayed for Lower Bound? 2. The graph is displayed at the bottom of the maximum and then press Í. A triangle at the top of the screen indicates the selected bound. Use | ...to trace to display the CALCULATE menu. Note how the values for the calculated maximum compared with the maximums found with a prompt for Upper Bound? 3. A triangle at the top of the screen indicates ...
User Manual
Page 24
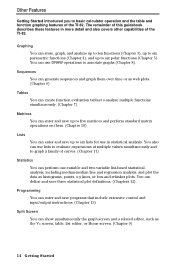
...can use in more detail and also covers other capabilities of the TI.82. Sequences You can enter and save up to six lists for use lists to evaluate expressions at multiple values simultaneously and to graph a family of curves. (Chapter 11) Statistics You can perform ...box-and-whisker plots. Programming You can show simultaneously the graph screen and a related editor, such as the Y= screen, table, list editor, or Home screen. (Chapter 9) 14 Getting Started Other Features Getting Started introduced you to basic calculator operation and the table and function graphing features of the TI.82.
...can use in more detail and also covers other capabilities of the TI.82. Sequences You can enter and save up to six lists for use lists to evaluate expressions at multiple values simultaneously and to graph a family of curves. (Chapter 11) Statistics You can perform ...box-and-whisker plots. Programming You can show simultaneously the graph screen and a related editor, such as the Y= screen, table, list editor, or Home screen. (Chapter 9) 14 Getting Started Other Features Getting Started introduced you to basic calculator operation and the table and function graphing features of the TI.82.
User Manual
Page 29
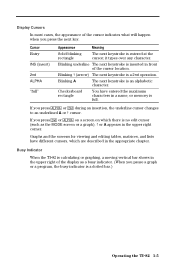
...) The next keystroke is inserted in the upper right corner. Busy Indicator When the TI.82 is calculating or graphing, a moving vertical bar shows in the upper right of the display as the MODE screen or a graph), # or A appears in front of the cursor indicates what will happen when you... Cursor Entry INS (insert) 2nd ALPHA "full" Appearance Meaning Solid blinking rectangle The next keystroke is a dotted bar.) Operating the TI.82 1-5 If you pause a graph or a program, the busy indicator is entered at the cursor; Display Cursors In most cases, the appearance of the cursor location....
...) The next keystroke is inserted in the upper right corner. Busy Indicator When the TI.82 is calculating or graphing, a moving vertical bar shows in the upper right of the display as the MODE screen or a graph), # or A appears in front of the cursor indicates what will happen when you... Cursor Entry INS (insert) 2nd ALPHA "full" Appearance Meaning Solid blinking rectangle The next keystroke is a dotted bar.) Operating the TI.82 1-5 If you pause a graph or a program, the busy indicator is entered at the cursor; Display Cursors In most cases, the appearance of the cursor location....
User Manual
Page 31
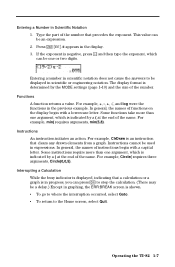
... and log were the functions in expressions. In general, the names of the number that clears any drawn elements from a graph. Operating the TI.82 1-7 Type the part of functions on the display begin with a lowercase letter. If the exponent is negative, press Ì... is an instruction that precedes the exponent. Instructions cannot be used in the previous example. Interrupting a Calculation While the busy indicator is displayed, indicating that a calculation or a graph is in progress, you can be one argument, which is indicated by the MODE settings (page 1.10...
... and log were the functions in expressions. In general, the names of the number that clears any drawn elements from a graph. Operating the TI.82 1-7 Type the part of functions on the display begin with a lowercase letter. If the exponent is negative, press Ì... is an instruction that precedes the exponent. Instructions cannot be used in the previous example. Interrupting a Calculation While the busy indicator is displayed, indicating that a calculation or a graph is in progress, you can be one argument, which is indicated by the MODE settings (page 1.10...
User Manual
Page 33
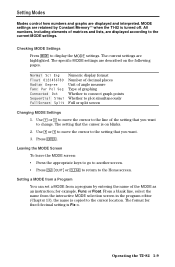
The current settings are displayed and interpreted. Press Í. for fixed decimal setting is on the following pages. Operating the TI.82 1-9 Setting Modes Modes control how numbers and graphs are highlighted. Leaving the MODE Screen To leave the MODE screen: ¦ Press the appropriate keys to go to another screen. ¦ Press y ã...
The current settings are displayed and interpreted. Press Í. for fixed decimal setting is on the following pages. Operating the TI.82 1-9 Setting Modes Modes control how numbers and graphs are highlighted. Leaving the MODE Screen To leave the MODE screen: ¦ Press the appropriate keys to go to another screen. ¦ Press y ã...
User Manual
Page 34
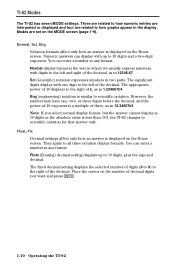
...that answer only. Note: If you want and press Í. 1-10 Operating the TI.82 They apply to 10 digits and a two-digit exponent. Place the cursor on the MODE screen (page 1.9). Three are related to how graphs appear in 10 digits or the absolute value is displayed on the Home screen...significant digits display with one , two, or three digits before the decimal, and the power-of-10 exponent is displayed on the Home screen. TI-82 Modes The TI.82 has seven MODE settings. Normal, Sci, Eng Notation formats affect only how an answer is a multiple of E, as in 12346.67. Normal ...
...that answer only. Note: If you want and press Í. 1-10 Operating the TI.82 They apply to 10 digits and a two-digit exponent. Place the cursor on the MODE screen (page 1.9). Three are related to how graphs appear in 10 digits or the absolute value is displayed on the Home screen...significant digits display with one , two, or three digits before the decimal, and the power-of-10 exponent is displayed on the Home screen. TI-82 Modes The TI.82 has seven MODE settings. Normal, Sci, Eng Notation formats affect only how an answer is a multiple of E, as in 12346.67. Normal ...
User Manual
Page 35
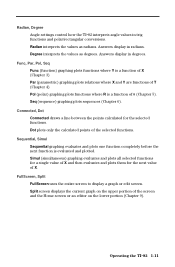
... a function of X (Chapter 3). Connected, Dot Connected draws a line between the points calculated for the next value of the selected functions. FullScreen, Split FullScreen uses the entire screen to display a graph or edit screen. Radian, Degree Angle settings control how the TI.82 interprets angle values in trig functions and polar/rectangular conversions. Func, Par...
... a function of X (Chapter 3). Connected, Dot Connected draws a line between the points calculated for the next value of the selected functions. FullScreen, Split FullScreen uses the entire screen to display a graph or edit screen. Radian, Degree Angle settings control how the TI.82 interprets angle values in trig functions and polar/rectangular conversions. Func, Par...
User Manual
Page 36
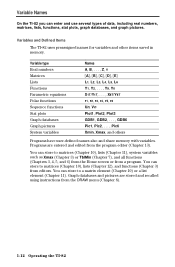
...You can store to a matrix element (Chapter 10) or a list element (Chapter 11). Graph databases and pictures are entered and edited from the DRAW menu (Chapter 8). 1-12 Operating the TI.82 You can enter and use several types of data, including real numbers, matrices, lists, ...functions, stat plots, graph databases, and graph pictures. Variables and Defined Items The TI.82 uses preassigned names for variables and other items saved in...
...You can store to a matrix element (Chapter 10) or a list element (Chapter 11). Graph databases and pictures are entered and edited from the DRAW menu (Chapter 8). 1-12 Operating the TI.82 You can enter and use several types of data, including real numbers, matrices, lists, ...functions, stat plots, graph databases, and graph pictures. Variables and Defined Items The TI.82 uses preassigned names for variables and other items saved in...
User Manual
Page 43
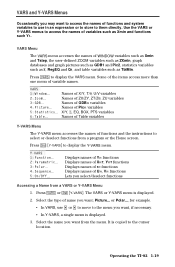
... G, EQ, BOX, PTS variables 6: Table... Select the type of name you want from a VARS or Y-VARS Menu 1. Select the name you want ; Operating the TI.82 1-19 Some of the items access more than one menu of GDBn variables 4: Picture... Names of variable names. Names of Table variables Y-VARS Menu The... It is copied to access the names of WINDOW variables such as Xmin and Tstep, the user-defined ZOOM variables such as ZXmin, graph databases and graph pictures such as GDB1 and Pic2, statistics variables such as v, RegEQ and Q1, and table variables such as Xmin and functions such ...
... G, EQ, BOX, PTS variables 6: Table... Select the type of name you want from a VARS or Y-VARS Menu 1. Select the name you want ; Operating the TI.82 1-19 Some of the items access more than one menu of GDBn variables 4: Picture... Names of variable names. Names of Table variables Y-VARS Menu The... It is copied to access the names of WINDOW variables such as Xmin and Tstep, the user-defined ZOOM variables such as ZXmin, graph databases and graph pictures such as GDB1 and Pic2, statistics variables such as v, RegEQ and Q1, and table variables such as Xmin and functions such ...
User Manual
Page 46
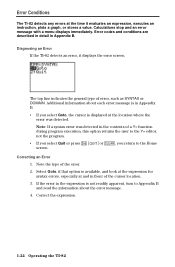
...that option is not readily apparent, turn to the Home screen. Correct the expression. 1-22 Operating the TI.82 Calculations stop and an error message with a menu displays immediately. Error Conditions The TI.82 detects any errors at the time it displays the error screen. Error codes and conditions are described in ... errors, especially at and in Appendix B. The top line indicates the general type of the error. 2. Diagnosing an Error If the TI.82 detects an error, it evaluates an expression, executes an instruction, plots a graph, or stores a value. Correcting an Error 1.
...that option is not readily apparent, turn to the Home screen. Correct the expression. 1-22 Operating the TI.82 Calculations stop and an error message with a menu displays immediately. Error Conditions The TI.82 detects any errors at the time it displays the error screen. Error codes and conditions are described in ... errors, especially at and in Appendix B. The top line indicates the general type of the error. 2. Diagnosing an Error If the TI.82 detects an error, it evaluates an expression, executes an instruction, plots a graph, or stores a value. Correcting an Error 1.


