User Manual
Page 36
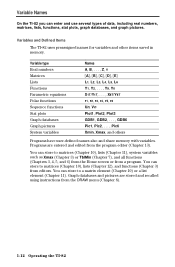
... from the program editor (Chapter 13). You can enter and use several types of data, including real numbers, matrices, lists, functions, stat plots, graph databases, and graph pictures. Variable Names On the TI.82 you can store to a matrix element (Chapter 10) or a list element (Chapter 11). You can store to matrices (Chapter 10), lists...
... from the program editor (Chapter 13). You can enter and use several types of data, including real numbers, matrices, lists, functions, stat plots, graph databases, and graph pictures. Variable Names On the TI.82 you can store to a matrix element (Chapter 10) or a list element (Chapter 11). You can store to matrices (Chapter 10), lists...

User Manual
Page 65
... can store the elements that define the current graph in one of the TI.82 to defining a graph. Saving a Graph You can plot, display, and explore it and then use several tools of six graph databases (Chapter 8). Deselect stat plots, if appropriate (Chapter 12.) Exploring a Graph Once you have defined a graph, you can recall that picture on the following...
... can store the elements that define the current graph in one of the TI.82 to defining a graph. Saving a Graph You can plot, display, and explore it and then use several tools of six graph databases (Chapter 8). Deselect stat plots, if appropriate (Chapter 12.) Exploring a Graph Once you have defined a graph, you can recall that picture on the following...

User Manual
Page 125
... You may want to store the current Y= functions to select StoreGDB). The new graph is not plotted. (The TI.82 changes graphing MODE automatically, if necessary.) Deleting a Graph Database Graph databases are replaced. Storing a Graph Database 1. Press y ãDRAWä | (to display the DRAW STO ...a stored database. 1. Press Í. Graph Databases The elements of elements that define a particular graph. StoreGDB is stored. The current database is copied to six graph databases and recall any Stat Plot definitions. RecallGDB GDBn 3. The graph can store up to the Home screen or...
... You may want to store the current Y= functions to select StoreGDB). The new graph is not plotted. (The TI.82 changes graphing MODE automatically, if necessary.) Deleting a Graph Database Graph databases are replaced. Storing a Graph Database 1. Press y ãDRAWä | (to display the DRAW STO ...a stored database. 1. Press Í. Graph Databases The elements of elements that define a particular graph. StoreGDB is stored. The current database is copied to six graph databases and recall any Stat Plot definitions. RecallGDB GDBn 3. The graph can store up to the Home screen or...

User Manual
Page 127
Chapter 9: Split Screen On the TI.82, you can simultaneously display a graph (including a stat plot) and an editor such as the Home screen, Y= editor, list editor, or table editor. Chapter Contents Getting Started: Polynomial Coefficients 9-2 Using Split Screen 9-3 Split Screen 9-1
Chapter 9: Split Screen On the TI.82, you can simultaneously display a graph (including a stat plot) and an editor such as the Home screen, Y= editor, list editor, or table editor. Chapter Contents Getting Started: Polynomial Coefficients 9-2 Using Split Screen 9-3 Split Screen 9-1
User Manual
Page 147
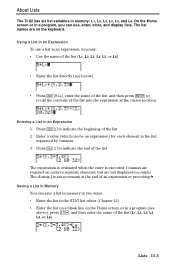
... commas. 3. Commas are required on entry to recall the contents of the list into the expression at the end of the list. 2. About Lists The TI.82 has six list variables in an Expression 1. Lists 11-3 Press y ã}ä to indicate the beginning of an expression or preceding !. Saving a List in Memory... You can save a list in memory in two ways: ¦ Enter the list in the STAT list editor (Chapter 12). ¦ Enter the list on a blank line on the keyboard.
... commas. 3. Commas are required on entry to recall the contents of the list into the expression at the end of the list. 2. About Lists The TI.82 has six list variables in an Expression 1. Lists 11-3 Press y ã}ä to indicate the beginning of an expression or preceding !. Saving a List in Memory... You can save a list in memory in two ways: ¦ Enter the list in the STAT list editor (Chapter 12). ¦ Enter the list on a blank line on the keyboard.

User Manual
Page 155
... Plotting 12-18 Statistical Plotting in a Program 12-22 Statistics 12-1 Chapter 12: Statistics This chapter describes the tools for analyzing statistical data on the TI.82. Chapter Contents Getting Started: Building Height and City Size ........ 12-2 Setting Up a Statistical Analysis 12-9 Viewing List Elements 12-10 Editing List Elements 12-11...
... Plotting 12-18 Statistical Plotting in a Program 12-22 Statistics 12-1 Chapter 12: Statistics This chapter describes the tools for analyzing statistical data on the TI.82. Chapter Contents Getting Started: Building Height and City Size ........ 12-2 Setting Up a Statistical Analysis 12-9 Viewing List Elements 12-10 Editing List Elements 12-11...

User Manual
Page 162
Press y ãSTAT PLOTä. Press Í to turn the plot off Y1 and Y2. Leave Mark as L4. ... (Med.Med model) for X=300,000 is shown. Press ~ Í to turn the plot on. Press to define Ylist as ›. 27. Press y ãSTAT PLOTä to the Home screen. Press q 9 to select Y1) £ 300000 ¤ ¢ 0 ¤ Í. Press ~ 1 (to...; } ~ y ãY-VARSä 1 2 Í. Press 1 to select Plot3. Press Í to turn off . You can use the TI.82 to compare different models on . Press y ãSTAT PLOTä. Press 2 to select Plot2. Press y ã...
Press y ãSTAT PLOTä. Press Í to turn the plot off Y1 and Y2. Leave Mark as L4. ... (Med.Med model) for X=300,000 is shown. Press ~ Í to turn the plot on. Press to define Ylist as ›. 27. Press y ãSTAT PLOTä to the Home screen. Press q 9 to select Y1) £ 300000 ¤ ¢ 0 ¤ Í. Press ~ 1 (to...; } ~ y ãY-VARSä 1 2 Í. Press 1 to select Plot3. Press Í to turn off . You can use the TI.82 to compare different models on . Press y ãSTAT PLOTä. Press 2 to select Plot2. Press y ã...

User Manual
Page 163
... menu. The full value of the STAT list editor displays up statistical calculations (page 12.13). 3. The center portion of the current element (indicated by pressing the appropriate key. ¦ Press y ãQUITä to return to the Home screen. The TI.82 has six list variables in memory that you... can delete the contents of a list in several ways: ¦ Use the ClrList instruction (page 12.12). ¦ Through the MEM menu (Chapter 16). ¦ In the STAT editor, press } to seven elements of...
... menu. The full value of the STAT list editor displays up statistical calculations (page 12.13). 3. The center portion of the current element (indicated by pressing the appropriate key. ¦ Press y ãQUITä to return to the Home screen. The TI.82 has six list variables in memory that you... can delete the contents of a list in several ways: ¦ Use the ClrList instruction (page 12.12). ¦ Through the MEM menu (Chapter 16). ¦ In the STAT editor, press } to seven elements of...
User Manual
Page 167
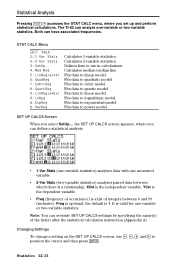
... SET UP CALCS screen, use in calculations. Statistical Analysis Pressing ... ~ accesses the STAT CALC menu, where you can define a statistical analysis. ¦ 1-Var Stats (one-variable statistics) analyzes data with one measured variable. ¦ 2-Var Stats (two-variable statistics) analyzes paired data between 0 and 99 (inclusive). The TI.82 can override SET UP CALCS settings by...
... SET UP CALCS screen, use in calculations. Statistical Analysis Pressing ... ~ accesses the STAT CALC menu, where you can define a statistical analysis. ¦ 1-Var Stats (one-variable statistics) analyzes data with one measured variable. ¦ 2-Var Stats (two-variable statistics) analyzes paired data between 0 and 99 (inclusive). The TI.82 can override SET UP CALCS settings by...
User Manual
Page 210
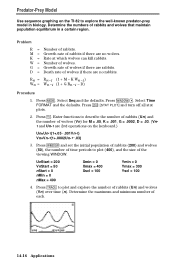
.... M = Growth rate of wolves (Vn) for M = .05, K = .001, G = .0002, D = .03. (Vn1 and Un-1 are rabbits. Press y [STAT PLOT] and turn off all stat plots. 2. Rn = RnN1 (1 + M - UnStart = 200 VnStart = 50 nStart = 0 nMin = 0 nMax = 400 Xmin = 0 Xmax = 400 Xscl = 100 Ymin ...graphing on the keyboard.) Un=Un-1(1+.05N.001Vn-1) Vn=Vn-1(1+.0002Un-1N.03) 3. D) Procedure 1. Press r to describe the number of rabbits (Un) and the number of rabbits if there are no wolves. Select Time FORMAT and the defaults. D = Death rate of wolves if there are 2nd operations on the TI.82...
.... M = Growth rate of wolves (Vn) for M = .05, K = .001, G = .0002, D = .03. (Vn1 and Un-1 are rabbits. Press y [STAT PLOT] and turn off all stat plots. 2. Rn = RnN1 (1 + M - UnStart = 200 VnStart = 50 nStart = 0 nMin = 0 nMax = 400 Xmin = 0 Xmax = 400 Xscl = 100 Ymin ...graphing on the keyboard.) Un=Un-1(1+.05N.001Vn-1) Vn=Vn-1(1+.0002Un-1N.03) 3. D) Procedure 1. Press r to describe the number of rabbits (Un) and the number of rabbits if there are no wolves. Select Time FORMAT and the defaults. D = Death rate of wolves if there are 2nd operations on the TI.82...

User Manual
Page 212
..., using the functions fnInt( and nDeriv( from the MATH MATH menu. Press y [STAT PLOT] and turn off all stat plots. 2. Use the cursor keys to compare the values of the two graphed functions, Y3 and Y4. 14-18 Applications Select Simul and the default MODE settings. ... of 1àT and the mathematical integral of 1àX and the function 1àX. Again, use the cursor keys to compare the values of Calculus The TI.82 can graph functions that 1 [ ‰ ] x Dx 1àt dt = 1àx 1 Procedure 1 1. Press z. Press o. Y3=nDeriv(Y1,X,X) Y4=1àX 6. The...
..., using the functions fnInt( and nDeriv( from the MATH MATH menu. Press y [STAT PLOT] and turn off all stat plots. 2. Use the cursor keys to compare the values of the two graphed functions, Y3 and Y4. 14-18 Applications Select Simul and the default MODE settings. ... of 1àT and the mathematical integral of 1àX and the function 1àX. Again, use the cursor keys to compare the values of Calculus The TI.82 can graph functions that 1 [ ‰ ] x Dx 1àt dt = 1àx 1 Procedure 1 1. Press z. Press o. Y3=nDeriv(Y1,X,X) Y4=1àX 6. The...

User Manual
Page 261
...list or matrix, but the dimensions do not match. You are undefined. Reference Information B-7 Error Conditions When the TI.82 detects an error, it are attempting to perform an operation that has more than upper. The general procedure for... example, a list where a real number is described on page 1.22. Examine a graph of arguments. for correcting errors is required. ARGUMENT BAD GUESS BOUND BREAK DATA TYPE DIM MISMATCH A function or instruction...stop evaluaton of an expression. for example, a matrix as an element in the STAT list editor.
...list or matrix, but the dimensions do not match. You are undefined. Reference Information B-7 Error Conditions When the TI.82 detects an error, it are attempting to perform an operation that has more than upper. The general procedure for... example, a list where a real number is described on page 1.22. Examine a graph of arguments. for correcting errors is required. ARGUMENT BAD GUESS BOUND BREAK DATA TYPE DIM MISMATCH A function or instruction...stop evaluaton of an expression. for example, a matrix as an element in the STAT list editor.

User Manual
Page 276
..., 6-6, A-28 - See WINDOW Vn, Vn-1, 1-19, 6-2 to 16-8 Transpose: T, 10-12, A-20 Trig functions, 2-3 Tstep, 4-4, 4-5, B-4, B-9 Turning functions on and off, 1-19 Turning the TI.82 on and off, 1-2 2-Var Stats, 12-13, 12-14, A-21 Two-variable statistics, 12-13, 12-14 - T - W - V - value, 3-21, 4-6, 5-6 Variables, x, 1-12, 1-13, A-28 VARS menu, 1-19, 3-9 Vertical, 8-3, 8-5, A-21...
..., 6-6, A-28 - See WINDOW Vn, Vn-1, 1-19, 6-2 to 16-8 Transpose: T, 10-12, A-20 Trig functions, 2-3 Tstep, 4-4, 4-5, B-4, B-9 Turning functions on and off, 1-19 Turning the TI.82 on and off, 1-2 2-Var Stats, 12-13, 12-14, A-21 Two-variable statistics, 12-13, 12-14 - T - W - V - value, 3-21, 4-6, 5-6 Variables, x, 1-12, 1-13, A-28 VARS menu, 1-19, 3-9 Vertical, 8-3, 8-5, A-21...


