User Guide
Page 35
... 1 1-VAR 2 A+BX 3 _+CX2 4 In X 5 e^X 6 A•B^X 7 A•X^B 8 1/X Statistical Calculation Single-variable Linear regression Quadratic regression Logarithmic regression e exponential regression ab exponential regression Power regression Inverse regression E-33 Examples of the f key toggles between the two forms. f f Appendix π Fraction → Decimal ' → Decimal Statistical Calculation (STAT) All calculations in this section are performed in the...
... 1 1-VAR 2 A+BX 3 _+CX2 4 In X 5 e^X 6 A•B^X 7 A•X^B 8 1/X Statistical Calculation Single-variable Linear regression Quadratic regression Logarithmic regression e exponential regression ab exponential regression Power regression Inverse regression E-33 Examples of the f key toggles between the two forms. f f Appendix π Fraction → Decimal ' → Decimal Statistical Calculation (STAT) All calculations in this section are performed in the...
User Guide
Page 39
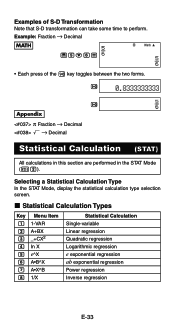
...commands that appear on the sub-menus that appear when you select 4(Sum), 5(Var), or 6(MinMax) on the STAT menu while a single-variable statistical calculation type is selected. Sum Sub-menu (11(STAT)4(Sum)) Select this menu item: 1Σx2 2Σx When you want to obtain this : 7Reg ...Item Select this menu item: When you want to do this : Sum of squares of the sample data Sum of commands for regression calculations • For details see "Commands when Linear Regression Calculation (A+BX) Is Selected" and "Commands when Quadratic Regression Calculation (_+CX2) Is Selected".
...commands that appear on the sub-menus that appear when you select 4(Sum), 5(Var), or 6(MinMax) on the STAT menu while a single-variable statistical calculation type is selected. Sum Sub-menu (11(STAT)4(Sum)) Select this menu item: 1Σx2 2Σx When you want to obtain this : 7Reg ...Item Select this menu item: When you want to do this : Sum of squares of the sample data Sum of commands for regression calculations • For details see "Commands when Linear Regression Calculation (A+BX) Is Selected" and "Commands when Quadratic Regression Calculation (_+CX2) Is Selected".
User Guide
Page 42
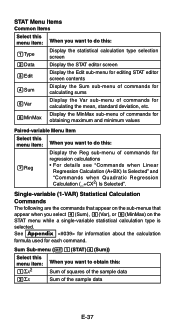
... samples, mean, standard deviation), and MinMax sub-menu (maximum value, minimum value) operations are the same those for each regression type, refer to the indicated calculation formulas ( Appendix to ). E-40 Appendix Quadratic Regression Calculation: to • Examples through all use the data input in Example . *1 Estimated Value (y = -3 → m = ?) *2 Estimated Value (x = 2 → n = ?) Commands when...
... samples, mean, standard deviation), and MinMax sub-menu (maximum value, minimum value) operations are the same those for each regression type, refer to the indicated calculation formulas ( Appendix to ). E-40 Appendix Quadratic Regression Calculation: to • Examples through all use the data input in Example . *1 Estimated Value (y = -3 → m = ?) *2 Estimated Value (x = 2 → n = ?) Commands when...
Operating Guide
Page 23
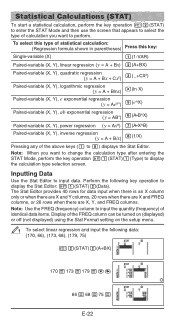
To select this type of statistical calculation: (Regression formula shown in parentheses) Press this key: Single-variable (X) 1(1-VAR) Paired-variable (X, Y), linear regression ( y = A + Bx) 2(A+BX) Paired-variable (X, Y), quadratic regression ( y = A + Bx + Cx2) 3( _+CX2) Paired-variable (X, Y), logarithmic regression ( y = A + Blnx) 4(ln X) Paired-variable (X, Y), e exponential regression ( y = AeBx) 5(e^X) Paired-variable (X, Y), ab exponential regression ( y = ABx) 6(A•B^X) Paired-variable (X, Y), power ...
To select this type of statistical calculation: (Regression formula shown in parentheses) Press this key: Single-variable (X) 1(1-VAR) Paired-variable (X, Y), linear regression ( y = A + Bx) 2(A+BX) Paired-variable (X, Y), quadratic regression ( y = A + Bx + Cx2) 3( _+CX2) Paired-variable (X, Y), logarithmic regression ( y = A + Blnx) 4(ln X) Paired-variable (X, Y), e exponential regression ( y = AeBx) 5(e^X) Paired-variable (X, Y), ab exponential regression ( y = ABx) 6(A•B^X) Paired-variable (X, Y), power ...
Operating Guide
Page 24
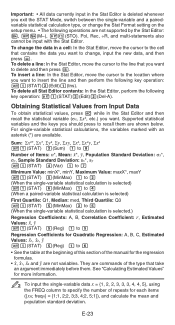
...line and then perform the following operations are not supported by the Stat Editor: m, 1m(M-), 1t(STO). For single-variable statistical calculations, the variables marked with the Stat Editor. To change the data in a cell: In the Stat Editor, move the cursor to...data currently input in the Stat Editor is selected.) Regression Coefficients: A, B, Correlation Coefficient: r, Estimated Values: m, n 11(STAT) 5(Reg) 1 to 5 Regression Coefficients for Quadratic Regression: A, B, C, Estimated Values: m1, m2, n 11(STAT) 5(Reg) 1 to 6 • See the table at the beginning of this section of the ...
...line and then perform the following operations are not supported by the Stat Editor: m, 1m(M-), 1t(STO). For single-variable statistical calculations, the variables marked with the Stat Editor. To change the data in a cell: In the Stat Editor, move the cursor to...data currently input in the Stat Editor is selected.) Regression Coefficients: A, B, Correlation Coefficient: r, Estimated Values: m, n 11(STAT) 5(Reg) 1 to 5 Regression Coefficients for Quadratic Regression: A, B, C, Estimated Values: m1, m2, n 11(STAT) 5(Reg) 1 to 6 • See the table at the beginning of this section of the ...

Operating Guide
Page 25
... completing the operations in 3.) A 160 11(STAT)5(Reg)5(n)= Result: 8106.898 Important: Regression coefficient, correlation coefficient, and estimated value calculations can be calculated for a value of y in the regression formula. 4 To determine the estimate value for y when x = 160 in the ...regression formula produced by paired-variable statistical calculation, the estimated value of y can take considerable time when there are a large number of quadratic regression) also can be calculated for a given x-value. The corresponding x-value (two values, x1 and x2, ...
... completing the operations in 3.) A 160 11(STAT)5(Reg)5(n)= Result: 8106.898 Important: Regression coefficient, correlation coefficient, and estimated value calculations can be calculated for a value of y in the regression formula. 4 To determine the estimate value for y when x = 160 in the ...regression formula produced by paired-variable statistical calculation, the estimated value of y can take considerable time when there are a large number of quadratic regression) also can be calculated for a given x-value. The corresponding x-value (two values, x1 and x2, ...


