User Guide
Page 39
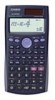
... the Edit sub-menu for editing STAT editor screen contents 4Sum Display the Sum sub-menu of commands for calculating sums 5Var Display the Var sub-menu of commands for calculating the mean, standard deviation, etc. 6MinMax Display the MinMax sub-menu of commands for obtaining maximum and minimum values Paired-variable Menu Item...
... the Edit sub-menu for editing STAT editor screen contents 4Sum Display the Sum sub-menu of commands for calculating sums 5Var Display the Var sub-menu of commands for calculating the mean, standard deviation, etc. 6MinMax Display the MinMax sub-menu of commands for obtaining maximum and minimum values Paired-variable Menu Item...
User Guide
Page 40
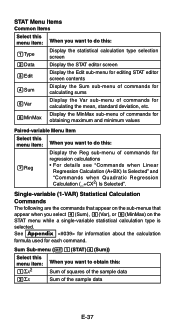
... through all use the same data as the statistical calculation type. Calculate minimum value and maximum value. See Appendix for information about the calculation formula used for each command. Calculate number of the sample data Population standard deviation Sample standard deviation MinMax Sub-menu (11(STAT)6(MinMax)) Select this menu...3xσn 4xσn-1 Number of samples Mean of samples, mean, and population standard deviation. Commands when Linear Regression Calculation (A+BX) Is Selected With linear regression, regression is performed in accordance with the following...
... through all use the same data as the statistical calculation type. Calculate minimum value and maximum value. See Appendix for information about the calculation formula used for each command. Calculate number of the sample data Population standard deviation Sample standard deviation MinMax Sub-menu (11(STAT)6(MinMax)) Select this menu...3xσn 4xσn-1 Number of samples Mean of samples, mean, and population standard deviation. Commands when Linear Regression Calculation (A+BX) Is Selected With linear regression, regression is performed in accordance with the following...

User Guide
Page 41
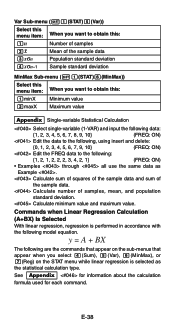
... 3xσn 4xσn-1 5p 6yσn 7yσn-1 Number of samples Mean of the X-data Population standard deviation of the X-data Sample standard deviation of the X-data Mean of the Y-data Population standard deviation of the Y-data Sample standard deviation of the Y-data MinMax Sub-menu (11(STAT)6(MinMax)) Select this menu item: When you want to...
... 3xσn 4xσn-1 5p 6yσn 7yσn-1 Number of samples Mean of the X-data Population standard deviation of the X-data Sample standard deviation of the X-data Mean of the Y-data Population standard deviation of the Y-data Sample standard deviation of the Y-data MinMax Sub-menu (11(STAT)6(MinMax)) Select this menu item: When you want to...
User Guide
Page 42
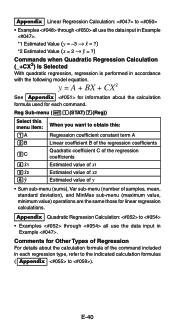
y = A + BX + CX 2 See Appendix for information about the calculation formula of samples, mean, standard deviation), and MinMax sub-menu (maximum value, minimum value) operations are the same those for each regression type, refer to the indicated calculation formulas ( Appendix to ). Appendix Quadratic Regression Calculation: to • Examples through all use the data input in Example . *1 Estimated...
y = A + BX + CX 2 See Appendix for information about the calculation formula of samples, mean, standard deviation), and MinMax sub-menu (maximum value, minimum value) operations are the same those for each regression type, refer to the indicated calculation formulas ( Appendix to ). Appendix Quadratic Regression Calculation: to • Examples through all use the data input in Example . *1 Estimated...
Operating Guide
Page 24
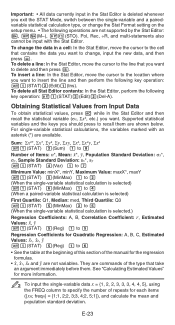
...line and then perform the following key operation: 11(STAT)3(Edit)1(Ins). freqn} = {1;1, 2;2, 3;3, 4;2, 5;1}), and calculate the mean and population standard deviation. To delete a line: In the Stat Editor, move the cursor to the line that contains the data you should...Mode, switch between the single-variable and a pairedvariable statistical calculation type, or change the Stat Format setting on the setup menu. • The following operations are commands of Items: n*, Mean: o*, p, Population Standard Deviation: σx*, σy, Sample Standard Deviation: sx*, sy 11(STAT) 4(Var) 1 to 7 ...
...line and then perform the following key operation: 11(STAT)3(Edit)1(Ins). freqn} = {1;1, 2;2, 3;3, 4;2, 5;1}), and calculate the mean and population standard deviation. To delete a line: In the Stat Editor, move the cursor to the line that contains the data you should...Mode, switch between the single-variable and a pairedvariable statistical calculation type, or change the Stat Format setting on the setup menu. • The following operations are commands of Items: n*, Mean: o*, p, Population Standard Deviation: σx*, σy, Sample Standard Deviation: sx*, sy 11(STAT) 4(Var) 1 to 7 ...

Operating Guide
Page 25
...number of the data in 3.) A 160 11(STAT)5(Reg)5(n)= Result: 8106.898 Important: Regression coefficient, correlation coefficient, and estimated value calculations can be calculated for the strongest correlation: (x, y) = (20, 3150), (110, 7310), (200, 8800), (290, 9310). Specify Fix 3... 1 = 2 = 3 = 4 = 5 =ce 1 = 2 = 3 = 2 = A11(STAT)4(Var)2(o)= A11(STAT)4(Var)3(σx)= Results: Mean: 3 Population Standard Deviation: 1.154700538 3 To calculate the linear regression and logarithmic regression correlation coefficients for the following operation after completing the operations in 3.
...number of the data in 3.) A 160 11(STAT)5(Reg)5(n)= Result: 8106.898 Important: Regression coefficient, correlation coefficient, and estimated value calculations can be calculated for the strongest correlation: (x, y) = (20, 3150), (110, 7310), (200, 8800), (290, 9310). Specify Fix 3... 1 = 2 = 3 = 4 = 5 =ce 1 = 2 = 3 = 2 = A11(STAT)4(Var)2(o)= A11(STAT)4(Var)3(σx)= Results: Mean: 3 Population Standard Deviation: 1.154700538 3 To calculate the linear regression and logarithmic regression correlation coefficients for the following operation after completing the operations in 3.


