
Software User Guide
Page 3
... 1. Binary, Octal, Decimal, and Hexadecimal Calculations with Integers 2-38 8. Matrix Calculations...2-41 9. Switching between List Files 3-17 5. Manual Graphing...5-25 7. Modifying a Graph...5-36 9. Function Analysis ...5-52 ii Contents Getting Acquainted - Option (OPTN) Menu 1-27 6. Variable Data (VARS) Menu 1-28 7. Basic Calculations...2-1 2. Using CSV ...
... 1. Binary, Octal, Decimal, and Hexadecimal Calculations with Integers 2-38 8. Matrix Calculations...2-41 9. Switching between List Files 3-17 5. Manual Graphing...5-25 7. Modifying a Graph...5-36 9. Function Analysis ...5-52 ii Contents Getting Acquainted - Option (OPTN) Menu 1-27 6. Variable Data (VARS) Menu 1-28 7. Basic Calculations...2-1 2. Using CSV ...

Software User Guide
Page 13
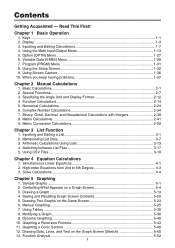
... the decimal point in this limit are automatically converted to 1.2 × 10¹². This results in 1.2 twelve places to 1.2 × 10⁻³. This means that exceed this manual show 21 columns and 8 lines of the examples in 1.2 three places to 10 digits long. Text Screen Graph Screen k Normal Display The calculator normally displays...
... the decimal point in this limit are automatically converted to 1.2 × 10¹². This results in 1.2 twelve places to 1.2 × 10⁻³. This means that exceed this manual show 21 columns and 8 lines of the examples in 1.2 three places to 10 digits long. Text Screen Graph Screen k Normal Display The calculator normally displays...
Software User Guide
Page 14
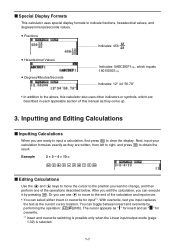
...' 56.78" • In addition to the above, this calculator also uses other indicators or symbols, which are described in each applicable section of this manual as " " for overwrite. *1 Insert and overwrite switching is possible only when the Linear input/output mode (page 1-32) is selected. 1-7 Example 2 + 3 - 4 + 10 = Ac+d-e+baw k Editing...
...' 56.78" • In addition to the above, this calculator also uses other indicators or symbols, which are described in each applicable section of this manual as " " for overwrite. *1 Insert and overwrite switching is possible only when the Linear input/output mode (page 1-32) is selected. 1-7 Example 2 + 3 - 4 + 10 = Ac+d-e+baw k Editing...
Software User Guide
Page 29
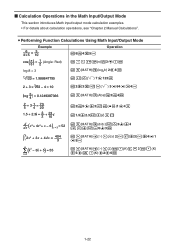
... k Calculation Operations in the Math Input/Output Mode This section introduces Math input/output mode calculation examples. • For details about calculation operations, see "Chapter 2 Manual Calculations".
... k Calculation Operations in the Math Input/Output Mode This section introduces Math input/output mode calculation examples. • For details about calculation operations, see "Chapter 2 Manual Calculations".
Software User Guide
Page 40
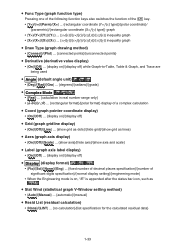
u Func Type (graph function type) Pressing one of the following function keys also switches the function of the v key. • {Y=}/{r=}/{Parm}/{X=} ... {rectangular coordinate (Y= f (x) type)}/{polar coordinate}/ {parametric}/{rectangular coordinate (X= f (y) type)} graph • {Y>}/{Yf(x)}/{y}/{Xf(y)}/{x
u Func Type (graph function type) Pressing one of the following function keys also switches the function of the v key. • {Y=}/{r=}/{Parm}/{X=} ... {rectangular coordinate (Y= f (x) type)}/{polar coordinate}/ {parametric}/{rectangular coordinate (X= f (y) type)} graph • {Y>}/{Yf(x)}/{y}/{Xf(y)}/{x
Software User Guide
Page 42
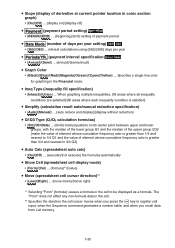
... graphing multiple inequalities, {fill areas where all inequality conditions are satisfied}/{fill areas where each inequality condition is satisfied} u Simplify (calculation result auto/manual reduction specification) • {Auto}/{Manual} ... {auto reduce and display}/{display without reduction} u Q1Q3 Type (Q1/Q3 calculation formulas) • {Std}/{OnData} ... {divide total population on }/{display off} u Payment...
... graphing multiple inequalities, {fill areas where all inequality conditions are satisfied}/{fill areas where each inequality condition is satisfied} u Simplify (calculation result auto/manual reduction specification) • {Auto}/{Manual} ... {auto reduce and display}/{display without reduction} u Q1Q3 Type (Q1/Q3 calculation formulas) • {Std}/{OnData} ... {divide total population on }/{display off} u Payment...
Software User Guide
Page 47
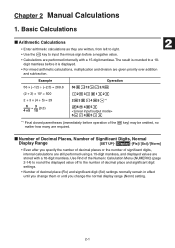
... left to input the minus sign before operation of the Numeric Calculation Menu (NUMERIC) (page 2-14) to round the displayed value off to a 10- Chapter 2 Manual Calculations 1. key to right. • Use the - Use Rnd of the w key) may be omitted, no matter how many are performed internally with a 10-digit...
... left to input the minus sign before operation of the Numeric Calculation Menu (NUMERIC) (page 2-14) to round the displayed value off to a 10- Chapter 2 Manual Calculations 1. key to right. • Use the - Use Rnd of the w key) may be omitted, no matter how many are performed internally with a 10-digit...

Software User Guide
Page 52
... an improper fraction ( b c ) to |106|. • When the calculation result can be displayed in the form nπ n is an integer up to a mixed fraction ( a b c ). *2 When "Manual" is specified for negative signs Example 1 2sin30, 10log1.2, 2'3, 2Pol(5, 12), etc. • Before constants, variable names, memory names Example 2 2π, 2AB, 3Ans, 3Y1, etc. •...
... an improper fraction ( b c ) to |106|. • When the calculation result can be displayed in the form nπ n is an integer up to a mixed fraction ( a b c ). *2 When "Manual" is specified for negative signs Example 1 2sin30, 10log1.2, 2'3, 2Pol(5, 12), etc. • Before constants, variable names, memory names Example 2 2π, 2AB, 3Ans, 3Y1, etc. •...
Software User Guide
Page 71
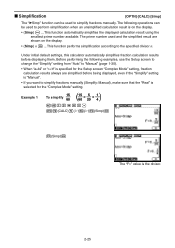
... calculator automatically simplifies fraction calculation results before being displayed, even if the "Simplify" setting is "Manual". • If you want to simplify fractions manually (Simplify: Manual), make sure that the "Real" is the divisor. 2-25 Before performing the following operations can... simplification according to the specified divisor n. The following examples, use the Setup screen to change the "Simplify" setting from "Auto" to "Manual" (page 1-35). • When "a+bi" or "r∠θ" is specified for the "Complex Mode" setting. This function automatically simplifies...
... calculator automatically simplifies fraction calculation results before being displayed, even if the "Simplify" setting is "Manual". • If you want to simplify fractions manually (Simplify: Manual), make sure that the "Real" is the divisor. 2-25 Before performing the following operations can... simplification according to the specified divisor n. The following examples, use the Setup screen to change the "Simplify" setting from "Auto" to "Manual" (page 1-35). • When "a+bi" or "r∠θ" is specified for the "Complex Mode" setting. This function automatically simplifies...
Software User Guide
Page 80
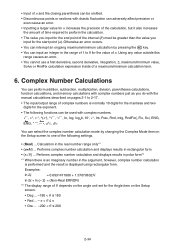
... complex number calculation mode by pressing the A key. • You can perform addition, subtraction, multiplication, division, parentheses calculations, function calculations, and memory calculations with the manual calculations described on pages 2-1 to 2-17. • The input/output range of complex numbers is displayed using rectangular form. Calculation in rectangular form • {r∠...
... complex number calculation mode by pressing the A key. • You can perform addition, subtraction, multiplication, division, parentheses calculations, function calculations, and memory calculations with the manual calculations described on pages 2-1 to 2-17. • The input/output range of complex numbers is displayed using rectangular form. Calculation in rectangular form • {r∠...

Software User Guide
Page 81
... the same as those you use !a(i) in place of K3(COMPLEX)1(i). • Solutions obtained by the Real, a+bi and r∠Ƨ modes are different for manual calculations. You can also use for power root (x') calculations when x < 0 and y = m/n when n is an odd number.
... the same as those you use !a(i) in place of K3(COMPLEX)1(i). • Solutions obtained by the Real, a+bi and r∠Ƨ modes are different for manual calculations. You can also use for power root (x') calculations when x < 0 and y = m/n when n is an odd number.
Software User Guide
Page 133
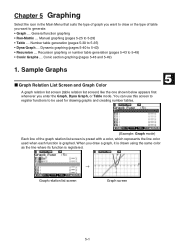
... one shown below appears first whenever you want to generate. • Graph ... Recursion graphing or number table generation (pages 5-43 to 5-35) • Dyna Graph ... Manual graphing (pages 5-25 to 5-43) • Recursion ... When you draw a graph, it is drawn using the same color as the line where its function is...
... one shown below appears first whenever you want to generate. • Graph ... Recursion graphing or number table generation (pages 5-43 to 5-35) • Dyna Graph ... Manual graphing (pages 5-25 to 5-43) • Recursion ... When you draw a graph, it is drawn using the same color as the line where its function is...

Software User Guide
Page 157
...; • cosh θ • tanh-1 θ • lnθ • 3'θ - Input for x and θ variables is not required for drawing the rectangular coordinate graph. 5. Manual Graphing k Rectangular Coordinate Graph Inputting the Graph command in function. - From the Main Menu, enter the Run-Matrix mode. 2.
...; • cosh θ • tanh-1 θ • lnθ • 3'θ - Input for x and θ variables is not required for drawing the rectangular coordinate graph. 5. Manual Graphing k Rectangular Coordinate Graph Inputting the Graph command in function. - From the Main Menu, enter the Run-Matrix mode. 2.
Software User Guide
Page 169
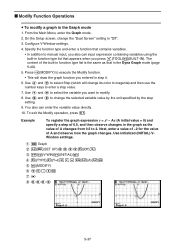
... the Graph mode. 2. Press 5(MODIFY) to execute the Modify function. • This will change its color to magenta) and then use the number keys to manual input, you also can enter the variable value directly. 10. Example To register the graph expression y = x2 − Ax (A initial value = 0) and specify a step of...
... the Graph mode. 2. Press 5(MODIFY) to execute the Modify function. • This will change its color to magenta) and then use the number keys to manual input, you also can enter the variable value directly. 10. Example To register the graph expression y = x2 − Ax (A initial value = 0) and specify a step of...
Software User Guide
Page 194
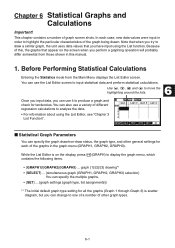
... (graph type, list assignments)} *1 The initial default graph type setting for tendencies. Because of the graph being drawn. In each of the graphs in this manual. 1. Before Performing Statistical Calculations Entering the Statistics mode from those shown in the graph menu (GRAPH1, GRAPH2, GRAPH3). You can use the List Editor screen...
... (graph type, list assignments)} *1 The initial default graph type setting for tendencies. Because of the graph being drawn. In each of the graphs in this manual. 1. Before Performing Statistical Calculations Entering the Statistics mode from those shown in the graph menu (GRAPH1, GRAPH2, GRAPH3). You can use the List Editor screen...
Software User Guide
Page 200
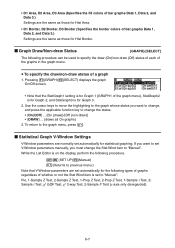
...each of bar graphs Data 1, Data 2, and Data 3.) Settings are the same as those for the following procedure. !m(SET UP)2(Manual) J(Returns to "Manual". u To specify the draw/non-draw status of whether or not the Stat Wind item is on the display, perform the ...statistical graphing. k Statistical Graph V-Window Settings V-Window parameters are set automatically for Graph 3. 2. While the List Editor is set V-Window parameters manually, you want to change, and press the applicable function key to change the Stat Wind item to the graph menu, press J. Pressing 1(GRAPH...
...each of bar graphs Data 1, Data 2, and Data 3.) Settings are the same as those for the following procedure. !m(SET UP)2(Manual) J(Returns to "Manual". u To specify the draw/non-draw status of whether or not the Stat Wind item is on the display, perform the ...statistical graphing. k Statistical Graph V-Window Settings V-Window parameters are set automatically for Graph 3. 2. While the List Editor is set V-Window parameters manually, you want to change, and press the applicable function key to change the Stat Wind item to the graph menu, press J. Pressing 1(GRAPH...
Software User Guide
Page 222
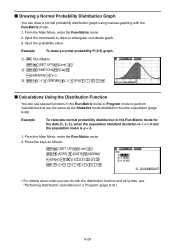
... the same as follows. !m(SET UP)2(Line)J K5(STAT)3(DIST)1(NORM) 1(Npd)!*( { )b,c,d !/( } ),b.f,c)w • For details about what you can draw a normal probability distribution graph using manual graphing with the distribution function and its syntax, see "Performing Distribution Calculations in a Program" (page 8-41). 6-29 Press the keys as the Statistics mode distribution...
... the same as follows. !m(SET UP)2(Line)J K5(STAT)3(DIST)1(NORM) 1(Npd)!*( { )b,c,d !/( } ),b.f,c)w • For details about what you can draw a normal probability distribution graph using manual graphing with the distribution function and its syntax, see "Performing Distribution Calculations in a Program" (page 8-41). 6-29 Press the keys as the Statistics mode distribution...
Software User Guide
Page 244
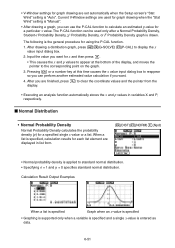
..." setting is "Auto". The P-CAL function can use the P-CAL function to calculate an estimated p-value for graph drawing when the "Stat Wind" setting is "Manual". • After drawing a graph, you want for x and then press w. • This causes the x and p values to appear at this time causes the x value input...
..." setting is "Auto". The P-CAL function can use the P-CAL function to calculate an estimated p-value for graph drawing when the "Stat Wind" setting is "Manual". • After drawing a graph, you want for x and then press w. • This causes the x and p values to appear at this time causes the x value input...
Software User Guide
Page 296
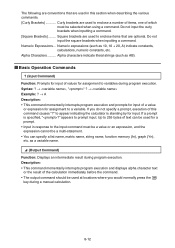
... command. • The output command should be selected when using a command. Numeric expressions (such as a variable name. ^ (Output Command) Function: Displays an intermediate result during a manual calculation. 8-12 as 10, 10 + 20, A) indicate constants, calculations, numeric constants, etc. Up to 255 bytes of a value or expression for a prompt. • Input in...
... command. • The output command should be selected when using a command. Numeric expressions (such as a variable name. ^ (Output Command) Function: Displays an intermediate result during a manual calculation. 8-12 as 10, 10 + 20, A) indicate constants, calculations, numeric constants, etc. Up to 255 bytes of a value or expression for a prompt. • Input in...
Software User Guide
Page 312
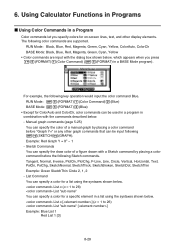
...can specify a color for a specific element in combination with a Sketch command by placing a color command before the following !4(SKETCH)5(GRAPH). Manual graph commands (page 5-25) You can specify the color of a figure drawn with the commands described below . For example, the following...(!f(FORMAT) in a Program Color commands let you specify colors for on-screen lines, text, and other graph commands that can specify the draw color of a manual graph by placing a color command before "Graph Y=" or any other display elements. 6. List n (n = 1 to 26) List "sub name" [] Example...
...can specify a color for a specific element in combination with a Sketch command by placing a color command before the following !4(SKETCH)5(GRAPH). Manual graph commands (page 5-25) You can specify the color of a figure drawn with the commands described below . For example, the following...(!f(FORMAT) in a Program Color commands let you specify colors for on-screen lines, text, and other graph commands that can specify the draw color of a manual graph by placing a color command before "Graph Y=" or any other display elements. 6. List n (n = 1 to 26) List "sub name" [] Example...

