
Software User Guide
Page 3
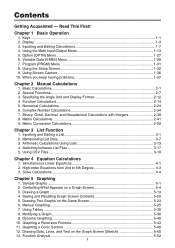
Inputting and Editing Calculations 1-7 4. Basic Calculations...2-1 2. Complex Number Calculations 2-34 7. Manipulating List Data 3-7 3. Arithmetic Calculations Using Lists 3-13 4. Solve Calculations...4-4 Chapter 5 Graphing 1. Saving and Recalling Graph Screen Contents 5-20 5. Drawing Two Graphs on a Graph Screen 5-4 ... the Math Input/Output Mode 1-13 5. Using the Setup Screen 1-32 9. Binary, Octal, Decimal, and Hexadecimal Calculations with Integers 2-38 8. Modifying a Graph...5-36 9. Graphing a Recursion Formula 5-43 11. Program (PRGM) Menu 1-31 8....
Inputting and Editing Calculations 1-7 4. Basic Calculations...2-1 2. Complex Number Calculations 2-34 7. Manipulating List Data 3-7 3. Arithmetic Calculations Using Lists 3-13 4. Solve Calculations...4-4 Chapter 5 Graphing 1. Saving and Recalling Graph Screen Contents 5-20 5. Drawing Two Graphs on a Graph Screen 5-4 ... the Math Input/Output Mode 1-13 5. Using the Setup Screen 1-32 9. Binary, Octal, Decimal, and Hexadecimal Calculations with Integers 2-38 8. Modifying a Graph...5-36 9. Graphing a Recursion Formula 5-43 11. Program (PRGM) Menu 1-31 8....
Software User Guide
Page 4
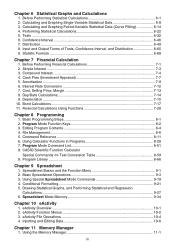
......10-1 2. Calculating and Graphing Single-Variable Statistical Data 6-8 3. Confidence Interval ...6-46 7. Day/Date Calculations 7-14 9. CASIO Scientific Function Calculator Special Commands ⇔...Calculations 1. Command Reference 8-11 6. Basic Programming Steps 8-1 2. Simple Interest ...7-3 3. Distribution ...6-49 8. Program Mode Function Keys 8-2 3. Program Mode Command List 8-51 8. Calculating and Graphing Paired-Variable Statistical Data (Curve Fitting 6-14 4. Performing Statistical Calculations 6-22 5. Financial Calculations Using Functions 7-20...
......10-1 2. Calculating and Graphing Single-Variable Statistical Data 6-8 3. Confidence Interval ...6-46 7. Day/Date Calculations 7-14 9. CASIO Scientific Function Calculator Special Commands ⇔...Calculations 1. Command Reference 8-11 6. Basic Programming Steps 8-1 2. Simple Interest ...7-3 3. Distribution ...6-49 8. Program Mode Function Keys 8-2 3. Program Mode Command List 8-51 8. Calculating and Graphing Paired-Variable Statistical Data (Curve Fitting 6-14 4. Performing Statistical Calculations 6-22 5. Financial Calculations Using Functions 7-20...
Software User Guide
Page 27
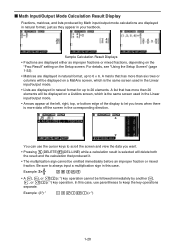
.... In this case. Example: (32)-1 (dx)!)(x-1) 1-20 A matrix that has more than 20 elements will be displayed on a MatAns screen, which is selected will delete both the result and the calculation that has more data off the screen in the corresponding ...cannot be followed immediately by Math input/output mode calculations are displayed in your textbook. Sample Calculation Result Displays • Fractions are displayed in this case, use the cursor keys to 20 elements. k Math Input/Output Mode Calculation Result Display Fractions, matrices, and lists produced by ...
.... In this case. Example: (32)-1 (dx)!)(x-1) 1-20 A matrix that has more than 20 elements will be displayed on a MatAns screen, which is selected will delete both the result and the calculation that has more data off the screen in the corresponding ...cannot be followed immediately by Math input/output mode calculations are displayed in your textbook. Sample Calculation Result Displays • Fractions are displayed in this case, use the cursor keys to 20 elements. k Math Input/Output Mode Calculation Result Display Fractions, matrices, and lists produced by ...
Software User Guide
Page 29
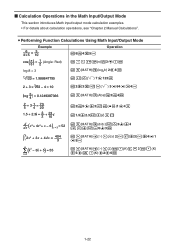
u Performing Function Calculations Using Math Input/Output Mode Example 6 4×5 = 3 10 ( ) cos π 3 = 1 2 (Angle: Rad) log28 = 3 A6v4*5w Operation Ac(!E(π)v3e)w A4(MATH)2(logab) 2e8w 7 123 = 1.988647795 A!M(x') 7e123w 2 + 3 × 3 64 − 4 = 10 A2+3*!M(x') 3e64e-4w log 3 4 = 0.1249387366 2 5 + 3 1 4 = 73 20 1.5 + 2.3i = 3 2 + 23 10 i A4(MATH)3(Abs)l3v4w A2v5e+3!v(()1e4w A1.5+2.3!a(i)wM ( ) d dx x3...
u Performing Function Calculations Using Math Input/Output Mode Example 6 4×5 = 3 10 ( ) cos π 3 = 1 2 (Angle: Rad) log28 = 3 A6v4*5w Operation Ac(!E(π)v3e)w A4(MATH)2(logab) 2e8w 7 123 = 1.988647795 A!M(x') 7e123w 2 + 3 × 3 64 − 4 = 10 A2+3*!M(x') 3e64e-4w log 3 4 = 0.1249387366 2 5 + 3 1 4 = 73 20 1.5 + 2.3i = 3 2 + 23 10 i A4(MATH)3(Abs)l3v4w A2v5e+3!v(()1e4w A1.5+2.3!a(i)wM ( ) d dx x3...
Software User Guide
Page 43
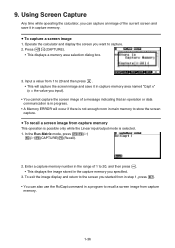
...K6(g) 6(g)5(CAPTURE)1(Recall). 2. Press !h(CAPTURE). • This displays a memory area selection dialog box. 3. Enter a capture memory number in the range of 1 to 20, and then press w. • This displays the image stored in a program to recall a screen image from 1 to the screen you specified. 3. To exit the... is in progress. • A Memory ERROR will capture the screen image and save it in main memory to capture. 2. Operate the calculator and display the screen you input). • You cannot capture the screen image of the current screen and save it in capture memory area...
...K6(g) 6(g)5(CAPTURE)1(Recall). 2. Press !h(CAPTURE). • This displays a memory area selection dialog box. 3. Enter a capture memory number in the range of 1 to 20, and then press w. • This displays the image stored in a program to recall a screen image from 1 to the screen you specified. 3. To exit the... is in progress. • A Memory ERROR will capture the screen image and save it in main memory to capture. 2. Operate the calculator and display the screen you input). • You cannot capture the screen image of the current screen and save it in capture memory area...
Software User Guide
Page 61
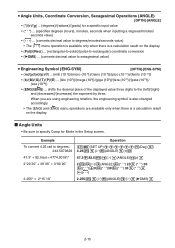
...ENG}/{ENG} ... shifts the decimal place of the displayed value three digits to degrees: 243.5070629 47.3° + 82.5rad = 4774.20181° 2°20´30˝ + 39´30˝ = 3°00´00˝ 2.255° = 2°15´18˝ Operation !m(SET ...using engineering notation, the engineering symbol is also changed accordingly. • The {ENG} and {ENG} menu operations are available only when there is a calculation result on the display. • {Pol(}/{Rec(} ... {rectangular-to-polar}/{polar-to-rectangular} coordinate conversion • {'DMS} ... {converts decimal value...
...ENG}/{ENG} ... shifts the decimal place of the displayed value three digits to degrees: 243.5070629 47.3° + 82.5rad = 4774.20181° 2°20´30˝ + 39´30˝ = 3°00´00˝ 2.255° = 2°15´18˝ Operation !m(SET ...using engineering notation, the engineering symbol is also changed accordingly. • The {ENG} and {ENG} menu operations are available only when there is a calculation result on the display. • {Pol(}/{Rec(} ... {rectangular-to-polar}/{polar-to-rectangular} coordinate conversion • {'DMS} ... {converts decimal value...
Software User Guide
Page 66
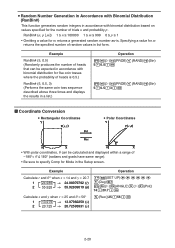
...; 24.98979792 (r) 2 55.928 → 55.92839019 (θ) !m(SET UP)cccccc 1(Deg)J K6(g)5(ANGLE)6(g)1(Pol() 14,20.7)w Calculate x and y when r = 25 and Ƨ = 56° 1 13.979 → 13.97982259 (x) 2 20.725 → 20.72593931 (y) 2(Rec() 25,56)w 2-20 RanBin# (n, p [,m]) 1 < n < 100000 1 < m < 999 0 < p < 1 • Omitting a value for m returns the specified number of random values in accordance...
...; 24.98979792 (r) 2 55.928 → 55.92839019 (θ) !m(SET UP)cccccc 1(Deg)J K6(g)5(ANGLE)6(g)1(Pol() 14,20.7)w Calculate x and y when r = 25 and Ƨ = 56° 1 13.979 → 13.97982259 (x) 2 20.725 → 20.72593931 (y) 2(Rec() 25,56)w 2-20 RanBin# (n, p [,m]) 1 < n < 100000 1 < m < 999 0 < p < 1 • Omitting a value for m returns the specified number of random values in accordance...
Software User Guide
Page 71
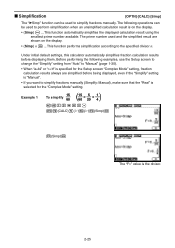
... simplify fractions manually (Simplify: Manual), make sure that the "Real" is specified for the Setup screen "Complex Mode" setting, fraction calculation results always are shown on the display. • {Simp} w ... Before performing the following operations can be used to simplify fractions... 1-35). • When "a+bi" or "r∠θ" is selected for the "Complex Mode" setting. Example 1 15 To simplify 60 15 = 5 = 1 60 20 4 A$bfcgaw K4(CALC)6(g)6(g)3(Simp)w 3(Simp)w The "F=" value is on the display. • {Simp} n w ... k Simplification [OPTN]-[CALC]-[Simp] The "'Simp" ...
... simplify fractions manually (Simplify: Manual), make sure that the "Real" is specified for the Setup screen "Complex Mode" setting, fraction calculation results always are shown on the display. • {Simp} w ... Before performing the following operations can be used to simplify fractions... 1-35). • When "a+bi" or "r∠θ" is selected for the "Complex Mode" setting. Example 1 15 To simplify 60 15 = 5 = 1 60 20 4 A$bfcgaw K4(CALC)6(g)6(g)3(Simp)w 3(Simp)w The "F=" value is on the display. • {Simp} n w ... k Simplification [OPTN]-[CALC]-[Simp] The "'Simp" ...
Software User Guide
Page 94
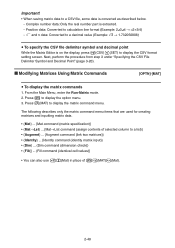
Next, perform the procedure from step 3 under "Specifying the CSV File Delimiter Symbol and Decimal Point" (page 3-20). Press 2(MAT) to display the option menu. 3. Complex number data: Only the real number part is on the display, press 4(CSV)3(SET... file, some data is converted as described below. - k Modifying Matrices Using Matrix Commands [OPTN]-[MAT] u To display the matrix commands 1. Fraction data: Converted to calculation line format (Example: 2{3{4 → =2+3/4) - ' and π data: Converted to display the CSV format setting screen. From the Main Menu, enter the Run-Matrix...
Next, perform the procedure from step 3 under "Specifying the CSV File Delimiter Symbol and Decimal Point" (page 3-20). Press 2(MAT) to display the option menu. 3. Complex number data: Only the real number part is on the display, press 4(CSV)3(SET... file, some data is converted as described below. - k Modifying Matrices Using Matrix Commands [OPTN]-[MAT] u To display the matrix commands 1. Fraction data: Converted to calculation line format (Example: 2{3{4 → =2+3/4) - ' and π data: Converted to display the CSV format setting screen. From the Main Menu, enter the Run-Matrix...
Software User Guide
Page 127
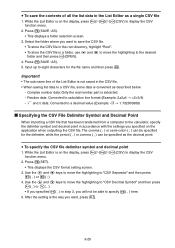
Select the folder where you want , press J. 3-20 While the List Editor is on the application when outputting the CSV file. Use the f and c keys to move the highlighting to eight characters for ... then press 1( . ) or 2( , ). • If you specified 1( , ) in the List Editor as the decimal point. While the List Editor is extracted. - Fraction data: Converted to calculation line format (Example: 2{3{4 → =2+3/4) - ' and π data: Converted to a decimal value (Example: '3 → 1.732050808) k Specifying the CSV File Delimiter Symbol and Decimal Point When importing...
Select the folder where you want , press J. 3-20 While the List Editor is on the application when outputting the CSV file. Use the f and c keys to move the highlighting to eight characters for ... then press 1( . ) or 2( , ). • If you specified 1( , ) in the List Editor as the decimal point. While the List Editor is extracted. - Fraction data: Converted to calculation line format (Example: 2{3{4 → =2+3/4) - ' and π data: Converted to a decimal value (Example: '3 → 1.732050808) k Specifying the CSV File Delimiter Symbol and Decimal Point When importing...
Software User Guide
Page 152
... in a memory area that already contains a function replaces the existing function with the new one. • If the data exceeds the calculator's remaining memory capacity, an error occurs. Saving and Recalling Graph Screen Contents You can be deleted. 4. The function menu and status are... 20 graph memories numbered G-Mem1 to recall, and then press w. Press a number key to specify the graph memory for the function you want to G-Mem20. • Storing a function in this calculator. Press 4(TOOL)2(GPH-MEM)2(RECALL) to save the...
... in a memory area that already contains a function replaces the existing function with the new one. • If the data exceeds the calculator's remaining memory capacity, an error occurs. Saving and Recalling Graph Screen Contents You can be deleted. 4. The function menu and status are... 20 graph memories numbered G-Mem1 to recall, and then press w. Press a number key to specify the graph memory for the function you want to G-Mem20. • Storing a function in this calculator. Press 4(TOOL)2(GPH-MEM)2(RECALL) to save the...
Software User Guide
Page 201
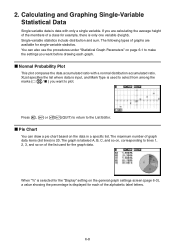
... are available for each graph. The maximum number of a class for example, there is displayed for single-variable statistics. The following types of graphs are calculating the average height of the members of graph data items (list lines) is data with a normal distribution accumulated ratio. The graph is selected for the... page 6-1 to the List Editor. If you want before drawing each of the list used for the "Display" setting on the data in a specific list. Calculating and Graphing Single-Variable Statistical Data Single-variable data is...
... are available for each graph. The maximum number of a class for example, there is displayed for single-variable statistics. The following types of graphs are calculating the average height of the members of graph data items (list lines) is data with a normal distribution accumulated ratio. The graph is selected for the... page 6-1 to the List Editor. If you want before drawing each of the list used for the "Display" setting on the data in a specific list. Calculating and Graphing Single-Variable Statistical Data Single-variable data is...
Software User Guide
Page 213
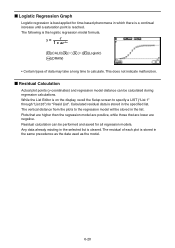
...as the data used as the model. 6-20 k Logistic Regression Graph Logistic regression is best applied for time-based phenomena in which there is a continual increase until a saturation point is cleared. Residual calculation can be performed and saved for "Resid ... Editor is stored in the selected list is reached. k Residual Calculation Actual plot points (y-coordinates) and regression model distance can be calculated during regression calculations. Calculated residual data is on the display, recall the Setup screen to calculate. y= c 1 + ae-bx 1(CALC)6(g)6(g)1(Logistic) 6(DRAW) ...
...as the data used as the model. 6-20 k Logistic Regression Graph Logistic regression is best applied for time-based phenomena in which there is a continual increase until a saturation point is cleared. Residual calculation can be performed and saved for "Resid ... Editor is stored in the selected list is reached. k Residual Calculation Actual plot points (y-coordinates) and regression model distance can be calculated during regression calculations. Calculated residual data is on the display, recall the Setup screen to calculate. y= c 1 + ae-bx 1(CALC)6(g)6(g)1(Logistic) 6(DRAW) ...

Software User Guide
Page 219
...). ca(value of yi) 1(xˆ )w The estimated value xˆ is displayed for xi = 20. From the Main Menu, enter the Run-Matrix mode. 4. u Regression Formula Copy Function from a Regression Calculation Result Screen In addition to the normal regression formula copy function that lets you copy the regression... mode. 2. k Estimated Value Calculation ( , ) After drawing a regression graph with the Statistics mode, you copy the regression formula obtained as follows. Press the keys as the result of ţ and xů when xi = 20 and yi = 1000 xi 10 15 20 25 30 yi 1003 1005 1010...
...). ca(value of yi) 1(xˆ )w The estimated value xˆ is displayed for xi = 20. From the Main Menu, enter the Run-Matrix mode. 4. u Regression Formula Copy Function from a Regression Calculation Result Screen In addition to the normal regression formula copy function that lets you copy the regression... mode. 2. k Estimated Value Calculation ( , ) After drawing a regression graph with the Statistics mode, you copy the regression formula obtained as follows. Press the keys as the result of ţ and xů when xi = 20 and yi = 1000 xi 10 15 20 25 30 yi 1003 1005 1010...

Software User Guide
Page 220
Determine what percentile does the 175.5 cm tall student fall in what percentage of 20 college students. Class no . Height (cm) Frequency 1 158.5 1 2 160.5 1 3 163.3 2 4 167.5 2 5 170.2 3 Class no . Standard Normal...186.7 1 6-27 obtains normal probability {P(t)}/{Q(t)}/{R(t)} value • {t(} ... {obtains normalized variate t(x) value} • Normal probability P(t), Q(t), and R(t), and normalized variate t(x) are calculated using the following table shows the results of measurements of the height of the students fall ? k Normal Probability Distribution...
Determine what percentile does the 175.5 cm tall student fall in what percentage of 20 college students. Class no . Height (cm) Frequency 1 158.5 1 2 160.5 1 3 163.3 2 4 167.5 2 5 170.2 3 Class no . Standard Normal...186.7 1 6-27 obtains normal probability {P(t)}/{Q(t)}/{R(t)} value • {t(} ... {obtains normalized variate t(x) value} • Normal probability P(t), Q(t), and R(t), and normalized variate t(x) are calculated using the following table shows the results of measurements of the height of the students fall ? k Normal Probability Distribution...
Software User Guide
Page 284
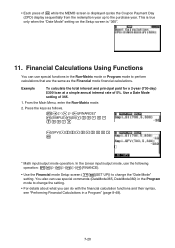
...use the following operation: K6(g)6(g)6(g)1(FINANCE). • Use the Financial mode Setup screen (!m(SET UP)) to perform calculations that are the same as follows. Example To calculate the total interest and principal paid for a 2-year (730-day) $300 loan at a simple annual ...in a Program" (page 8-48). 7-20 Use a Date Mode setting of 5%. From the Main Menu, enter the Run-Matrix mode. 2. Financial Calculations Using Functions You can do with the financial calculation functions and their syntax, see "Performing Financial Calculations in the Program mode to the purchase year...
...use the following operation: K6(g)6(g)6(g)1(FINANCE). • Use the Financial mode Setup screen (!m(SET UP)) to perform calculations that are the same as follows. Example To calculate the total interest and principal paid for a 2-year (730-day) $300 loan at a simple annual ...in a Program" (page 8-48). 7-20 Use a Date Mode setting of 5%. From the Main Menu, enter the Run-Matrix mode. 2. Financial Calculations Using Functions You can do with the financial calculation functions and their syntax, see "Performing Financial Calculations in the Program mode to the purchase year...
Software User Guide
Page 296
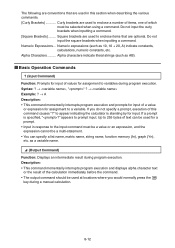
...expression for assignment to the input command must be selected when using a command. If you would normally press the w key during a manual calculation. 8-12 Numeric Expressions ... Syntax: ? → , "" ? → Example: ? → A Description: • This ...intermediate result during program execution. appears to variables during program execution. Alpha characters indicate literal strings (such as 10, 10 + 20, A) indicate constants, calculations, numeric constants, etc. k Basic Operation Commands ? (Input Command) Function: Prompts for a prompt. • Input in...
...expression for assignment to the input command must be selected when using a command. If you would normally press the w key during a manual calculation. 8-12 Numeric Expressions ... Syntax: ? → , "" ? → Example: ? → A Description: • This ...intermediate result during program execution. appears to variables during program execution. Alpha characters indicate literal strings (such as 10, 10 + 20, A) indicate constants, calculations, numeric constants, etc. k Basic Operation Commands ? (Input Command) Function: Prompts for a prompt. • Input in...

Software User Guide
Page 309
...page 8-27) to connect strings inside of numbers (like "123") or an expression (like "x-1") cannot be used to string memory (Str 1 through Str 20). Syntax: Exp'Str(, [)] Description: A graph expression (Yn, r, Xt, Yt, X), recursion formula (an, an+1, an+2, bn, bn+1, bn+2,... argument (). A string made up of an argument. • A function or command within a string function (Exp(, StrCmp(, etc.) is treated as a calculation. StrCmp( Function: Compares "" and "" (character code comparison). Returns 1 when "" > "". In a program, strings are used as a single character. Syntax...
...page 8-27) to connect strings inside of numbers (like "123") or an expression (like "x-1") cannot be used to string memory (Str 1 through Str 20). Syntax: Exp'Str(, [)] Description: A graph expression (Yn, r, Xt, Yt, X), recursion formula (an, an+1, an+2, bn, bn+1, bn+2,... argument (). A string made up of an argument. • A function or command within a string function (Exp(, StrCmp(, etc.) is treated as a calculation. StrCmp( Function: Compares "" and "" (character code comparison). Returns 1 when "" > "". In a program, strings are used as a single character. Syntax...

Software User Guide
Page 316
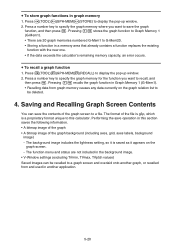
... of other . k Using Graph Functions in a Program You can incorporate graph functions into a program to draw complex graphs and to use when programming with the calculator keys. A Syntax ERROR will occur if you need to overlay graphs on top of syntax you input "Y" with graph functions. • V-Window View Window -5, 5, 1, -5, 5, 1_...
... of other . k Using Graph Functions in a Program You can incorporate graph functions into a program to draw complex graphs and to use when programming with the calculator keys. A Syntax ERROR will occur if you need to overlay graphs on top of syntax you input "Y" with graph functions. • V-Window View Window -5, 5, 1, -5, 5, 1_...

Software User Guide
Page 356
... folder where you save spreadsheet contents as required. When Auto Calc is enabled under initial factory default settings. u To execute spreadsheet re-calculation manually Press 1(FILE)4(RECALCS). This recalculates all of data is performed. Press 1(SAVE • AS). 5. Next, perform the procedure ...up to execute recalculation manually as a CSV file 1. note under "Specifying the CSV File Delimiter Symbol and Decimal Point" (page 3-20). u To specify the CSV file delimiter symbol and decimal point Press 1(FILE)5(CSV)3(SET) to perform recalculation if the spreadsheet contains a...
... folder where you save spreadsheet contents as required. When Auto Calc is enabled under initial factory default settings. u To execute spreadsheet re-calculation manually Press 1(FILE)4(RECALCS). This recalculates all of data is performed. Press 1(SAVE • AS). 5. Next, perform the procedure ...up to execute recalculation manually as a CSV file 1. note under "Specifying the CSV File Delimiter Symbol and Decimal Point" (page 3-20). u To specify the CSV file delimiter symbol and decimal point Press 1(FILE)5(CSV)3(SET) to perform recalculation if the spreadsheet contains a...


