
User Guide
Page 6
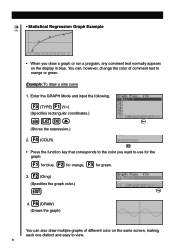
...: To draw a sine curve 1. • Statistical Regression Graph Example CFX • When you want to use for the graph: 1 2 3 for blue, for orange, for green. 2 3. (Orng) (Specifies the graph color.) J 6 6 4. (DRAW) (Draws the graph) You can , however, change the color of different color...multiple graphs of comment text to view. Enter the GRAPH Mode and input the following. 3(TYPE)1(Y=) (Specifies rectangular coordinates.) svwf (Stores the expression.) 45 4 2. (COLR) 23456 • Press the function key that corresponds to the color you draw a graph or run a program, any...
...: To draw a sine curve 1. • Statistical Regression Graph Example CFX • When you want to use for the graph: 1 2 3 for blue, for orange, for green. 2 3. (Orng) (Specifies the graph color.) J 6 6 4. (DRAW) (Draws the graph) You can , however, change the color of different color...multiple graphs of comment text to view. Enter the GRAPH Mode and input the following. 3(TYPE)1(Y=) (Specifies rectangular coordinates.) svwf (Stores the expression.) 45 4 2. (COLR) 23456 • Press the function key that corresponds to the color you draw a graph or run a program, any...
User Guide
Page 11
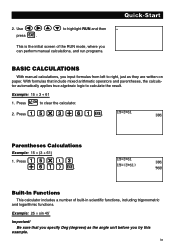
... formulas that you specify Deg (degrees) as they are written on paper. Built-In Functions This calculator includes a number of the RUN mode, where you can perform manual calculations, and run programs. Quick-Start BASIC CALCULATIONS With manual calculations, you try this example. Example: 25 × sin 45˚ Important! Example: 15 × 3 + 61 o 1. defc...
... formulas that you specify Deg (degrees) as they are written on paper. Built-In Functions This calculator includes a number of the RUN mode, where you can perform manual calculations, and run programs. Quick-Start BASIC CALCULATIONS With manual calculations, you try this example. Example: 25 × sin 45˚ Important! Example: 15 × 3 + 61 o 1. defc...
User Guide
Page 21
...key operations are being performed correctly. • Replace the main batteries once every 2 years regardless of the calculator. xix message appears on the back of how much the calculator is used during program execution can leak and damage the unit. • Keep batteries out of the reach of the unit, be... sure to watch the display to make sure that this clears all your calculator and subjecting it to stop working. ...
...key operations are being performed correctly. • Replace the main batteries once every 2 years regardless of the calculator. xix message appears on the back of how much the calculator is used during program execution can leak and damage the unit. • Keep batteries out of the reach of the unit, be... sure to watch the display to make sure that this clears all your calculator and subjecting it to stop working. ...
User Guide
Page 24
... Option (OPTN) Menu 27 Variable Data (VARS) Menu 28 Program (PRGM) Menu 34 Chapter 2 2-1 2-2 2-3 Manual Calculations 35 Basic Calculations 36 Special Functions 39 Function Calculations 43 Chapter 3 3-1 3-2 3-3 3-4 3-5 3-6 Numerical Calculations 53 Before Performing a Calculation 54 Differential Calculations 55 Quadratic Differential Calculations 58 Integration Calculations 60 Maximum/Minimum Value Calculations 63 Summation (Σ) Calculations 65 Chapter 4 Complex Numbers 67 4-1 Before Beginning a Complex Number...
... Option (OPTN) Menu 27 Variable Data (VARS) Menu 28 Program (PRGM) Menu 34 Chapter 2 2-1 2-2 2-3 Manual Calculations 35 Basic Calculations 36 Special Functions 39 Function Calculations 43 Chapter 3 3-1 3-2 3-3 3-4 3-5 3-6 Numerical Calculations 53 Before Performing a Calculation 54 Differential Calculations 55 Quadratic Differential Calculations 58 Integration Calculations 60 Maximum/Minimum Value Calculations 63 Summation (Σ) Calculations 65 Chapter 4 Complex Numbers 67 4-1 Before Beginning a Complex Number...
User Guide
Page 26
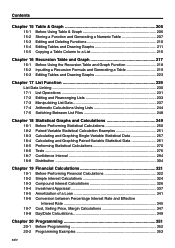
... 244 17-5 Switching Between List Files 248 Chapter 18 Statistical Graphs and Calculations 249 18-1 Before Performing Statistical Calculations 250 18-2 Paired-Variable Statistical Calculation Examples 251 18-3 Calculating and Graphing Single-Variable Statistical Data 257 18-4 Calculating and Graphing Paired-Variable Statistical Data 261 18-5 Performing Statistical Calculations 270 18-6 Tests ...276 18-7 Confidence Interval 294 18-8 Distribution...
... 244 17-5 Switching Between List Files 248 Chapter 18 Statistical Graphs and Calculations 249 18-1 Before Performing Statistical Calculations 250 18-2 Paired-Variable Statistical Calculation Examples 251 18-3 Calculating and Graphing Single-Variable Statistical Data 257 18-4 Calculating and Graphing Paired-Variable Statistical Data 261 18-5 Performing Statistical Calculations 270 18-6 Tests ...276 18-7 Confidence Interval 294 18-8 Distribution...
User Guide
Page 27
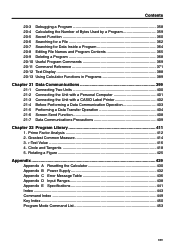
...Input Ranges 438 Appendix E Specifications 441 Index ...443 Command Index 449 Key Index ...450 Program Mode Command List 453 xxv Contents 20-3 Debugging a Program 358 20-4 Calculating the Number of Bytes Used by a Program 359 20-5 Secret Function 360 20-6 Searching for a File 362 20-7 Searching for Data...371 20-12 Text Display 388 20-13 Using Calculator Functions in Programs 389 Chapter 21 Data Communications 399 21-1 Connecting Two Units 400 21-2 Connecting the Unit with a Personal Computer 401 21-3 Connecting the Unit with a CASIO Label Printer 402 21-4 Before Performing a Data ...
...Input Ranges 438 Appendix E Specifications 441 Index ...443 Command Index 449 Key Index ...450 Program Mode Command List 453 xxv Contents 20-3 Debugging a Program 358 20-4 Calculating the Number of Bytes Used by a Program 359 20-5 Secret Function 360 20-6 Searching for a File 362 20-7 Searching for Data...371 20-12 Text Display 388 20-13 Using Calculator Functions in Programs 389 Chapter 21 Data Communications 399 21-1 Connecting Two Units 400 21-2 Connecting the Unit with a Personal Computer 401 21-3 Connecting the Unit with a CASIO Label Printer 402 21-4 Before Performing a Data ...


