User Manual
Page 20
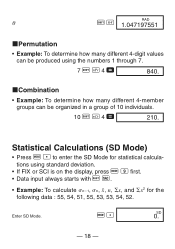
...8226; Example: To determine how many different 4-member groups can be organized in a group of 10 individuals. 10 A n 4 = 210. Statistical Calculations (SD Mode) • Press F l to enter the SD Mode for the following data : 55, 54, 51, 55, 53, 53, 54, 52. kCombination • Example: To determine how many different ... • If FIX or SCI is on the display, press F 9 first. • Data input always starts with A u. • Example: To calculate nҀ1, n, o, n, ⌺x, and ⌺x2 for statistical calculations using the numbers 1 through 7. 7 A m 4 = 840.
...8226; Example: To determine how many different 4-member groups can be organized in a group of 10 individuals. 10 A n 4 = 210. Statistical Calculations (SD Mode) • Press F l to enter the SD Mode for the following data : 55, 54, 51, 55, 53, 53, 54, 52. kCombination • Example: To determine how many different ... • If FIX or SCI is on the display, press F 9 first. • Data input always starts with A u. • Example: To calculate nҀ1, n, o, n, ⌺x, and ⌺x2 for statistical calculations using the numbers 1 through 7. 7 A m 4 = 840.
User Manual
Page 26
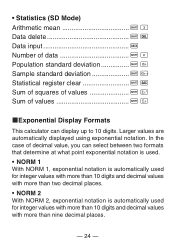
In the case of values A o kExponential Display Formats This calculator can select between two formats that determine at what point exponential notation is used. • NORM 1 With NORM 1, exponential notation is ... more than nine decimal places. - 24 - Larger values are automatically displayed using exponential notation. • Statistics (SD Mode) Arithmetic mean A ` Data delete A [ Data input Number of data A r Population standard deviation A p Sample standard deviation A q Statistical register clear A u Sum of squares of values A a Sum of decimal value, you can display up...
In the case of values A o kExponential Display Formats This calculator can select between two formats that determine at what point exponential notation is used. • NORM 1 With NORM 1, exponential notation is ... more than nine decimal places. - 24 - Larger values are automatically displayed using exponential notation. • Statistics (SD Mode) Arithmetic mean A ` Data delete A [ Data input Number of data A r Population standard deviation A p Sample standard deviation A q Statistical register clear A u Sum of squares of values A a Sum of decimal value, you can display up...


