User Manual
Page 2
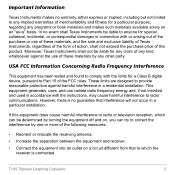
...on an "as-is" basis. TI-89 Titanium Graphing Calculator 2 If this product. This equipment generates, uses, and can radiate radio frequency energy and, if not installed and used in a residential installation. Important Information Texas Instruments makes no warranty, either express or implied, including ...equipment does cause harmful interference to radio or television reception, which the receiver is connected. However, there is no event shall Texas Instruments be determined by turning the equipment off and on, you can be liable to anyone for a Class B digital device, pursuant...
...on an "as-is" basis. TI-89 Titanium Graphing Calculator 2 If this product. This equipment generates, uses, and can radiate radio frequency energy and, if not installed and used in a residential installation. Important Information Texas Instruments makes no warranty, either express or implied, including ...equipment does cause harmful interference to radio or television reception, which the receiver is connected. However, there is no event shall Texas Instruments be determined by turning the equipment off and on, you can be liable to anyone for a Class B digital device, pursuant...
User Manual
Page 3
• Consult the dealer or an experienced radio/television technician for help. Caution: Any changes or modifications to this equipment not expressly approved by Texas Instruments may void your authority to operate the equipment. © 2005 Texas Instruments Incorporated Windows and Macintosh are trademarks of their respective owners. TI-89 Titanium Graphing Calculator 3
• Consult the dealer or an experienced radio/television technician for help. Caution: Any changes or modifications to this equipment not expressly approved by Texas Instruments may void your authority to operate the equipment. © 2005 Texas Instruments Incorporated Windows and Macintosh are trademarks of their respective owners. TI-89 Titanium Graphing Calculator 3

User Manual
Page 16
Displays the Graph screen. Displays the Apps desktop. Switches between insert and overwrite modes. Converts measurement units. Switches between the last two chosen Apps. Getting Started 16 Key ...
Displays the Graph screen. Displays the Apps desktop. Switches between insert and overwrite modes. Converts measurement units. Switches between the last two chosen Apps. Getting Started 16 Key ...

User Manual
Page 32
... 33.) Press ¸ or N to clear the message and return to confirm that the category is the default. 2 Š Organizr Customizable category. Getting Started 32 Graphing is the default. Key 2 ˆ Graphing Description Customizable category. Organizr (organizer) is the default. 2 ‰ Science Customizable category.
... 33.) Press ¸ or N to clear the message and return to confirm that the category is the default. 2 Š Organizr Customizable category. Getting Started 32 Graphing is the default. Key 2 ˆ Graphing Description Customizable category. Organizr (organizer) is the default. 2 ‰ Science Customizable category.
User Manual
Page 36
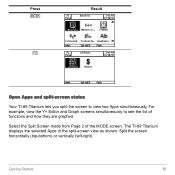
Getting Started 36 The TI-89 Titanium displays the selected Apps in the split-screen view as shown. Press ¸ † Result Open Apps and split-screen status Your TI-89 Titanium lets you split the screen to see the list of the MODE screen. For example, view the Y= Editor and Graph screens simultaneously to view two Apps simultaneously. Select the Split Screen mode from Page 2 of functions and how they are graphed. Split the screen horizontally (top-bottom) or vertically (left-right).
Getting Started 36 The TI-89 Titanium displays the selected Apps in the split-screen view as shown. Press ¸ † Result Open Apps and split-screen status Your TI-89 Titanium lets you split the screen to see the list of the MODE screen. For example, view the Y= Editor and Graph screens simultaneously to view two Apps simultaneously. Select the Split Screen mode from Page 2 of functions and how they are graphed. Split the screen horizontally (top-bottom) or vertically (left-right).
User Manual
Page 38
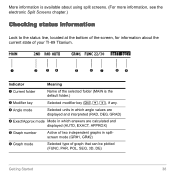
... displayed and interpreted (RAD, DEG, GRAD) Í Exact/Approx mode Mode in which answers are calculated and displayed (AUTO, EXACT, APPROX) Î Graph number Active of two independent graphs in splitscreen mode (GR#1, GR#2) Ï Graph mode Selected type of graph that can be plotted (FUNC, PAR, POL, SEQ, 3D, DE) Getting Started 38
... displayed and interpreted (RAD, DEG, GRAD) Í Exact/Approx mode Mode in which answers are calculated and displayed (AUTO, EXACT, APPROX) Î Graph number Active of two independent graphs in splitscreen mode (GR#1, GR#2) Ï Graph mode Selected type of graph that can be plotted (FUNC, PAR, POL, SEQ, 3D, DE) Getting Started 38

User Manual
Page 39
If BATT is highlighted with a black background, change the batteries as soon as possible ( ). Ò Busy/Pause, Locked/Archived variable BUSY-Calculation or graph is in progress PAUSE-You paused a graph or program Œ-Variable opened in the current editor is 99) in the history area of entry/answer pairs (default is 30...
If BATT is highlighted with a black background, change the batteries as soon as possible ( ). Ò Busy/Pause, Locked/Archived variable BUSY-Calculation or graph is in progress PAUSE-You paused a graph or program Œ-Variable opened in the current editor is 99) in the history area of entry/answer pairs (default is 30...
User Manual
Page 59
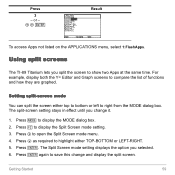
... D as required to highlight either top to bottom or left to right from the MODE dialog box. For example, display both the Y= Editor and Graph screens to display the MODE dialog box. 2. Setting split-screen mode You can split the screen either TOP-BOTTOM or LEFT-RIGHT. 5. Press B to save ...
... D as required to highlight either top to bottom or left to right from the MODE dialog box. For example, display both the Y= Editor and Graph screens to display the MODE dialog box. 2. Setting split-screen mode You can split the screen either TOP-BOTTOM or LEFT-RIGHT. 5. Press B to save ...

User Manual
Page 62
Mode Split 2 App Number of Graphs Description Lets you specify the App displayed in the bottom or right portion of available Apps. (See "... Lets you specify the App displayed in the bottom screen. Example: Display the Y= Editor in the top screen and the Graph App in the top or left portion of the split screen. Works together with Split 1 App, which lets you set... the initial App for the Split 2 App mode setting. To set up and display two independent graphs. Repeat steps 1 and 2 for each split-screen portion: 1. Press D or C to display a menu of the split screen.
Mode Split 2 App Number of Graphs Description Lets you specify the App displayed in the bottom or right portion of available Apps. (See "... Lets you specify the App displayed in the bottom screen. Example: Display the Y= Editor in the top screen and the Graph App in the top or left portion of the split screen. Works together with Split 1 App, which lets you set... the initial App for the Split 2 App mode setting. To set up and display two independent graphs. Repeat steps 1 and 2 for each split-screen portion: 1. Press D or C to display a menu of the split screen.
User Manual
Page 64
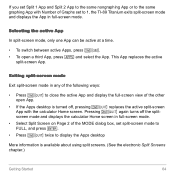
... the following ways: • Press 2 K to close the active App and display the full-screen view of Graphs set Split 1 App and Split 2 App to the same nongraphing App or to the same graphing App with the calculator Home screen. This App replaces the active split-screen App. Pressing 2 K again turns off...
... the following ways: • Press 2 K to close the active App and display the full-screen view of Graphs set Split 1 App and Split 2 App to the same nongraphing App or to the same graphing App with the calculator Home screen. This App replaces the active split-screen App. Pressing 2 K again turns off...
User Manual
Page 65
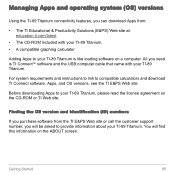
... the TI E&PS Web site. All you will find this information on a computer. Adding Apps to provide information about your TI-89 Titanium. • A compatible graphing calculator. Finding the OS version and identification (ID) numbers If you purchase software from : • The TI Educational & Productivity Solutions (E&PS) Web site at: education...
... the TI E&PS Web site. All you will find this information on a computer. Adding Apps to provide information about your TI-89 Titanium. • A compatible graphing calculator. Finding the OS version and identification (ID) numbers If you purchase software from : • The TI Educational & Productivity Solutions (E&PS) Web site at: education...
User Manual
Page 67
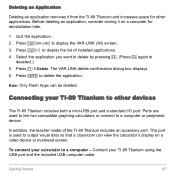
... your TI-89 Titanium to display the list of the TI-89 Titanium includes an accessory port. This port is used to link two compatible graphing calculators or connect to deselect.) 5. Deleting an Application Deleting an application removes it on a video device or overhead screen. Press 2 ° to output visual data...
... your TI-89 Titanium to display the list of the TI-89 Titanium includes an accessory port. This port is used to link two compatible graphing calculators or connect to deselect.) 5. Deleting an Application Deleting an application removes it on a video device or overhead screen. Press 2 ° to output visual data...
User Manual
Page 68
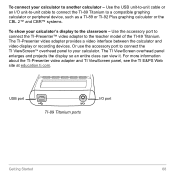
... - For more information about the TI-Presenter video adapter and TI ViewScreen panel, see the TI E&PS Web site at education.ti.com. USB port TI-89 Titanium ports I /O unit-to-unit cable to connect the TI-89 Titanium to a compatible graphing calculator or peripheral device, such as a TI-89 or TI...-92 Plus graphing calculator or the CBL 2™ and CBR™ systems. To show your calculator's display to your calculator to the teacher model of the TI-89 Titanium. Use the USB unit-to-unit cable or an I /O port Getting Started 68 The TI ViewScreen overhead panel enlarges and...
... - For more information about the TI-Presenter video adapter and TI ViewScreen panel, see the TI E&PS Web site at education.ti.com. USB port TI-89 Titanium ports I /O unit-to-unit cable to connect the TI-89 Titanium to a compatible graphing calculator or peripheral device, such as a TI-89 or TI...-92 Plus graphing calculator or the CBL 2™ and CBR™ systems. To show your calculator's display to your calculator to the teacher model of the TI-89 Titanium. Use the USB unit-to-unit cable or an I /O port Getting Started 68 The TI ViewScreen overhead panel enlarges and...

User Manual
Page 86
...will Previews 86 For _g, you can use the pre-defined constant available from the UNITS dialog box or you can type _g. Convert to graph a function using the Y= Editor. Using the same m, calculate the force for a unit, you can type it from the keyboard. Press... B 2 4 8 5 2 ™ KGF j ¸ Basic Function Graphing I The example in this section demonstrates some of the graphing capabilities of force (_kgf). 2 4 displays the 4 conversion operator. Press 5 8 5 2 ™ KG j p 20 8 5 2 ™ MS j ...
...will Previews 86 For _g, you can use the pre-defined constant available from the UNITS dialog box or you can type _g. Convert to graph a function using the Y= Editor. Using the same m, calculate the force for a unit, you can type it from the keyboard. Press... B 2 4 8 5 2 ™ KGF j ¸ Basic Function Graphing I The example in this section demonstrates some of the graphing capabilities of force (_kgf). 2 4 displays the 4 conversion operator. Press 5 8 5 2 ™ KG j p 20 8 5 2 ™ MS j ...

User Manual
Page 87
... at y1=. Press c ½ A ¸ X Z 2 | 3 d | 1 0 d e 2 ¸ 3. Press „ 6 Previews 87 Steps and keystrokes 1. Enter the function (abs(x2N3)N10)/2. Select 6:ZoomStd by pressing 6 or by graphing the function y=(|x2N3|N10)/2. Explore the graphing capabilities of the TI-89 Titanium by moving the cursor to the Home screen. Display the...
... at y1=. Press c ½ A ¸ X Z 2 | 3 d | 1 0 d e 2 ¸ 3. Press „ 6 Previews 87 Steps and keystrokes 1. Enter the function (abs(x2N3)N10)/2. Select 6:ZoomStd by pressing 6 or by graphing the function y=(|x2N3|N10)/2. Explore the graphing capabilities of the TI-89 Titanium by moving the cursor to the Home screen. Display the...

User Manual
Page 89
...circle using the standard viewing window (ZoomStd). Steps and keystrokes Display 1. For Graph mode, select FUNCTION. Transfer the result to adjust the viewing window. " minimum point minimum coordinates Basic Function Graphing II Graph a circle of the coordinate system. Display the MODE dialog box. Find the ...minimum point on the origin of radius 5, centered on the graph between the lower and upper bounds. Then use ZoomSqr...
...circle using the standard viewing window (ZoomStd). Steps and keystrokes Display 1. For Graph mode, select FUNCTION. Transfer the result to adjust the viewing window. " minimum point minimum coordinates Basic Function Graphing II Graph a circle of the coordinate system. Display the MODE dialog box. Find the ...minimum point on the origin of radius 5, centered on the graph between the lower and upper bounds. Then use ZoomSqr...

User Manual
Page 90
Then store the radius, 5, in variable r. 5!r Press " 5 9 j R ¸ 3. Display the Home screen. Then define y1(x) = (r2 - In function graphing, you can define y2(x) = Ly1(x). Press ¸ ? The bottom half is the negative of the top half, so you must define separate functions for the ...
Then store the radius, 5, in variable r. 5!r Press " 5 9 j R ¸ 3. Display the Home screen. Then define y1(x) = (r2 - In function graphing, you can define y2(x) = Ly1(x). Press ¸ ? The bottom half is the negative of the top half, so you must define separate functions for the ...

User Manual
Page 91
... shown in correct proportion. Steps and keystrokes Display 5. However, this range is a separate function. Select ZoomSqr. Previews 91 Select the ZoomStd viewing window, which automatically graphs the functions. ZoomSqr increases the range along the x axis than the y axis. Depending on the viewing window, however, the plotted endpoints for each half may...
... shown in correct proportion. Steps and keystrokes Display 5. However, this range is a separate function. Select ZoomSqr. Previews 91 Select the ZoomStd viewing window, which automatically graphs the functions. ZoomSqr increases the range along the x axis than the y axis. Depending on the viewing window, however, the plotted endpoints for each half may...

User Manual
Page 92
...select RADIAN. Press 8 Í D D D D D D B 1 ¸q Previews 92 For Graph mode, select FUNCTION. Basic Function Graphing III Use the "Detect Discontinuities" graph format to sequential "Seq" or simultaneous "Simul". Open the Y= Editor and enter y1(x)=1/(x1). Display the Graph Formats dialog box and set "Detect Discontinuities" to OFF Note: The second... item on the Graph Format dialog is not greyed out, which means it can be ...
...select RADIAN. Press 8 Í D D D D D D B 1 ¸q Previews 92 For Graph mode, select FUNCTION. Basic Function Graphing III Use the "Detect Discontinuities" graph format to sequential "Seq" or simultaneous "Simul". Open the Y= Editor and enter y1(x)=1/(x1). Display the Graph Formats dialog box and set "Detect Discontinuities" to OFF Note: The second... item on the Graph Format dialog is not greyed out, which means it can be ...

User Manual
Page 93
... sequential "Seq". Press 8 %q 5. Note: Graphing speed may slow considerably when "Detect Discontinuities" is set to ON. Observe the "faux" asymptotes contained in the graph. Press 8 Í D D D D D D B 2 ¸ 6. Execute the Graph command, which automatically displays the Graph screen. Note: The second item on the graph. Execute the Graph command, which automatically displays the Graph screen. Press 8 %(q Previews 93...
... sequential "Seq". Press 8 %q 5. Note: Graphing speed may slow considerably when "Detect Discontinuities" is set to ON. Observe the "faux" asymptotes contained in the graph. Press 8 Í D D D D D D B 2 ¸ 6. Execute the Graph command, which automatically displays the Graph screen. Note: The second item on the graph. Execute the Graph command, which automatically displays the Graph screen. Press 8 %(q Previews 93...


