User Manual
Page 119
... city of 300,000 people. Statistics and Data Plots Based on a sample of seven cities, enter data that relates population to display the Data/Matrix Editor. Press 3 B 1 ¸ Display 2. Create a new data variable named BUILD. For Graph mode, select FUNCTION. Steps and keystrokes 1. Use&#...8226;O to the number of buildings with more than 12 stories. Using Median-Median and linear regression calculations, find and plot equations to fit the data.
... city of 300,000 people. Statistics and Data Plots Based on a sample of seven cities, enter data that relates population to display the Data/Matrix Editor. Press 3 B 1 ¸ Display 2. Create a new data variable named BUILD. For Graph mode, select FUNCTION. Steps and keystrokes 1. Use&#...8226;O to the number of buildings with more than 12 stories. Using Median-Median and linear regression calculations, find and plot equations to fit the data.
User Manual
Page 182
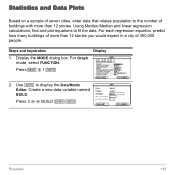
... then solve for the unknown variable. You can perform statistical calculations and graph statistical plots. Enter and edit programs and functions. Enter an expression or equation, define values for all but one shown below.) Operating the Calculator 182 Application: Table Data/Matrix Editor Program Editor Text Editor...the first letter of variable values that letter, the first one alphabetically is highlighted). Enter expressions and instructions, and perform calculations. From the Apps Desktop Press the first letter of the application name, or use the cursor keys to highlight an ...
... then solve for the unknown variable. You can perform statistical calculations and graph statistical plots. Enter and edit programs and functions. Enter an expression or equation, define values for all but one shown below.) Operating the Calculator 182 Application: Table Data/Matrix Editor Program Editor Text Editor...the first letter of variable values that letter, the first one alphabetically is highlighted). Enter expressions and instructions, and perform calculations. From the Apps Desktop Press the first letter of the application name, or use the cursor keys to highlight an ...

User Manual
Page 540
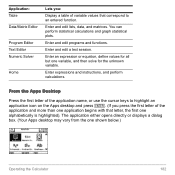
...functions. 5. Enter stat data in the Data/Matrix Editor. Note: You can also use the Y= Editor to the following pages. 1. Define and select stat plots („ and then ,). Set Graph mode (3) to perform a statistical calculation or graph a statistical plot. Statistics and Data Plots Overview of Steps in Statistical... Analysis This section gives an overview of the steps used to FUNCTION. 2.
...functions. 5. Enter stat data in the Data/Matrix Editor. Note: You can also use the Y= Editor to the following pages. 1. Define and select stat plots („ and then ,). Set Graph mode (3) to perform a statistical calculation or graph a statistical plot. Statistics and Data Plots Overview of Steps in Statistical... Analysis This section gives an overview of the steps used to FUNCTION. 2.

User Manual
Page 543
...you specify {1,4}, the calculation uses only data points with a category value of calculation. x Type the column number in the Y= Editor. This is a regression analysis, you can select a function name (y1(x), y2...(x), etc.). Freq Type the column number that Freq, Category, and Include Categories are assumed to have the same weight (1). Note that contains a "weight" value for x values, the independent variable. Statistics...
...you specify {1,4}, the calculation uses only data points with a category value of calculation. x Type the column number in the Y= Editor. This is a regression analysis, you can select a function name (y1(x), y2...(x), etc.). Freq Type the column number that Freq, Category, and Include Categories are assumed to have the same weight (1). Note that contains a "weight" value for x values, the independent variable. Statistics...

User Manual
Page 549
... nStat ÿ Gy Gy2 Sy sy Gxy minX Regressions Statistics and Data Plots 549 However, regCoef and regeq are stored as a list and a function variable, respectively. deviation of x number of data points mean of x values sum of x values sum of y population std. Calculated Variables Statistical variables are treated as system variables. deviation of y sum...
... nStat ÿ Gy Gy2 Sy sy Gxy minX Regressions Statistics and Data Plots 549 However, regCoef and regeq are stored as a list and a function variable, respectively. deviation of x number of data points mean of x values sum of x values sum of y population std. Calculated Variables Statistical variables are treated as system variables. deviation of y sum...

User Manual
Page 559
..., above the y(x) functions. Showing the List of Stat Plots Press 8 # to scroll above the y(x) functions. If a Plot is defined, it shows the same shorthand notation as you can on any other y(x) function. To see the list of stat plots, use C to display the Y= Editor. Initially, the nine stat plots are selected. Statistics and Data...
..., above the y(x) functions. Showing the List of Stat Plots Press 8 # to scroll above the y(x) functions. If a Plot is defined, it shows the same shorthand notation as you can on any other y(x) function. To see the list of stat plots, use C to display the Y= Editor. Initially, the nine stat plots are selected. Statistics and Data...

User Manual
Page 560
...item. Statistics and Data Plots 560 Graphing and Tracing a Defined Stat Plot After entering the data points and defining the stat plots, you can select and graph stat plots and y(x) functions at the same time. You will see the same definition screen that variable was not used to graph a function from the... Editor (as described in the Data/Matrix Editor. However, the plot definition lets you used for the plot. To Graph Plots and Y= Functions As necessary, you can graph the selected plots by using the same methods you select the mark used to create the definition. To: Edit a plot...
...item. Statistics and Data Plots 560 Graphing and Tracing a Defined Stat Plot After entering the data points and defining the stat plots, you can select and graph stat plots and y(x) functions at the same time. You will see the same definition screen that variable was not used to graph a function from the... Editor (as described in the Data/Matrix Editor. However, the plot definition lets you used for the plot. To Graph Plots and Y= Functions As necessary, you can graph the selected plots by using the same methods you select the mark used to create the definition. To: Edit a plot...

User Manual
Page 563
...let you enter a student's test scores, where: • The mid-semester exam is weighted twice as much as other statistical calculations or plots, the frequency value can be an integer , 0 if Calculation Type = OneVar or MedMed or if Plot Type = Box Plot. For other tests. • The final exam is... C or D to move to another plot or y(x) function, tracing moves to the current or beginning point on that plot (not to specify a frequency value (or weight) for the data points on each row. Example of the data points. Statistics and Data Plots 563 Using Frequencies and Categories To manipulate...
...let you enter a student's test scores, where: • The mid-semester exam is weighted twice as much as other statistical calculations or plots, the frequency value can be an integer , 0 if Calculation Type = OneVar or MedMed or if Plot Type = Box Plot. For other tests. • The final exam is... C or D to move to another plot or y(x) function, tracing moves to the current or beginning point on that plot (not to specify a frequency value (or weight) for the data points on each row. Example of the data points. Statistics and Data Plots 563 Using Frequencies and Categories To manipulate...

User Manual
Page 757
Activities 757 Studying Statistics: Filtering Data by Categories This activity provides a statistical study of the weights of the f(x) function is basically represented by the quadratic quotient y2(x). The lower graph is basically a quadratic function as x gets very large in both the positive and negative directions. The rational expression is y3(x)=f(x) graphed separately using categories to filter the data. Observe that the global behavior of high school students using the line style.
Activities 757 Studying Statistics: Filtering Data by Categories This activity provides a statistical study of the weights of the f(x) function is basically represented by the quadratic quotient y2(x). The lower graph is basically a quadratic function as x gets very large in both the positive and negative directions. The rational expression is y3(x)=f(x) graphed separately using categories to filter the data. Observe that the global behavior of high school students using the line style.

User Manual
Page 785
Statistics Strings ! (factorial) cumSum() LnReg median() NewData OneVar PowerReg rand() ShowStat SortD TwoVar 906 BldData 790 CubicReg 801 802 ExpReg 819 LinReg 836 838 Logistic 840 ... char() 791 dim() 810 expr() 818 format() 822 inString() 832 left() 834 mid() 843 ord() 850 right() 865 rotate() 865 shift() 874 string() 883 Appendix A: Functions and Instructions 785
Statistics Strings ! (factorial) cumSum() LnReg median() NewData OneVar PowerReg rand() ShowStat SortD TwoVar 906 BldData 790 CubicReg 801 802 ExpReg 819 LinReg 836 838 Logistic 840 ... char() 791 dim() 810 expr() 818 format() 822 inString() 832 left() 834 mid() 843 ord() 850 right() 865 rotate() 865 shift() 874 string() 883 Appendix A: Functions and Instructions 785

User Manual
Page 801
...184; list1 represents xlist. list5 does not have equal dimensions except for list5. {0,1,2,3}! CubicReg MATH/Statistics/Regressions menu CubicReg list1, list2[, [list3] [, list4, list5]] In function graphing mode. Note: list1 through list4 must have to be a variable name and cannot be a ...variable name or c1-c99 (columns in the last data variable shown in the Data/Matrix Editor). Calculates the cubic polynomial regression and updates all the statistics variables...
...184; list1 represents xlist. list5 does not have equal dimensions except for list5. {0,1,2,3}! CubicReg MATH/Statistics/Regressions menu CubicReg list1, list2[, [list3] [, list4, list5]] In function graphing mode. Note: list1 through list4 must have to be a variable name and cannot be a ...variable name or c1-c99 (columns in the last data variable shown in the Data/Matrix Editor). Calculates the cubic polynomial regression and updates all the statistics variables...

User Manual
Page 819
... var]) ⇒ expression factor(list1[,var]) ⇒ list factor(matrix1[,var]) ⇒ matrix factor(expression1) returns expression1 factored with respect to all the system statistics variables. list4 represents category codes. factor(a^3ù x^2ì aù x^2ì a^3+a) ¸ aø(a ì1)ø(a + 1)ø(x ì1)ø(x + ... real factors that are linear in each factor. ExpReg MATH/Statistics/Regressions menu ExpReg list1, list2 [, [list3] [, list4, list5]] In function graphing mode: Calculates the exponential regression and updates all of var are willing to...
... var]) ⇒ expression factor(list1[,var]) ⇒ list factor(matrix1[,var]) ⇒ matrix factor(expression1) returns expression1 factored with respect to all the system statistics variables. list4 represents category codes. factor(a^3ù x^2ì aù x^2ì a^3+a) ¸ aø(a ì1)ø(a + 1)ø(x ì1)ø(x + ... real factors that are linear in each factor. ExpReg MATH/Statistics/Regressions menu ExpReg list1, list2 [, [list3] [, list4, list5]] In function graphing mode: Calculates the exponential regression and updates all of var are willing to...

User Manual
Page 836
... line at the point specified. In a ZoomStd window: LineVert ë 2.5 ¸ LinReg MATH/Statistics/Regressions menu LinReg list1, list2[, [list3] [, list4, list5]] Calculates the linear regression and updates all drawn items. See also PxlVert. In function graphing mode: {0,1,2,3,4,5,6}! LineTan does not graph expression1. list1 represents xlist. L2 ¸ LinReg L1,L2 ¸ ShowStat ¸ {0 1 2 ...} {0 2 3 ...} Done...
... line at the point specified. In a ZoomStd window: LineVert ë 2.5 ¸ LinReg MATH/Statistics/Regressions menu LinReg list1, list2[, [list3] [, list4, list5]] Calculates the linear regression and updates all drawn items. See also PxlVert. In function graphing mode: {0,1,2,3,4,5,6}! LineTan does not graph expression1. list1 represents xlist. L2 ¸ LinReg L1,L2 ¸ ShowStat ¸ {0 1 2 ...} {0 2 3 ...} Done...

User Manual
Page 838
... they only exist temporarily. Local variables must be unlocked using the unlock instruction on global variables are deleted when the program or function finishes execution. Program listing: :prgmname() :Prgm :Local x,y :Input "Enter x",x :Input "Enter y",y :Disp xù y...variable without first using the Unlock command. {1,2,3,4}! LnReg MATH/Statistics/Regressions menu LnReg list1, list2[, [list3] [, list4, list5]] In function graphing mode: Calculates the logarithmic regression and updates all the system statistics variables. list3 represents frequency. L1 ¸ {1,2,3,4} Lock...
... they only exist temporarily. Local variables must be unlocked using the unlock instruction on global variables are deleted when the program or function finishes execution. Program listing: :prgmname() :Prgm :Local x,y :Input "Enter x",x :Input "Enter y",y :Disp xù y...variable without first using the Unlock command. {1,2,3,4}! LnReg MATH/Statistics/Regressions menu LnReg list1, list2[, [list3] [, list4, list5]] In function graphing mode: Calculates the logarithmic regression and updates all the system statistics variables. list3 represents frequency. L1 ¸ {1,2,3,4} Lock...

User Manual
Page 840
...does not have equal dimensions except for list5. block is a sequence of rolls is", i © 840 Appendix A: Functions and Instructions Program segment: © :1! Typically, larger values result in better accuracy but longer execution times, and vice... die1 : Rand(6)! list2 represents ylist. Logistic MATH/Statistics/Regressions menu Logistic list1, list2 [ , [iterations] , [list3] [, list4, list5] ] In function graphing mode: Calculates the logistic regression and updates all the system statistics variables. Loop CATALOG Loop block EndLoop Repeatedly executes the...
...does not have equal dimensions except for list5. block is a sequence of rolls is", i © 840 Appendix A: Functions and Instructions Program segment: © :1! Typically, larger values result in better accuracy but longer execution times, and vice... die1 : Rand(6)! list2 represents ylist. Logistic MATH/Statistics/Regressions menu Logistic list1, list2 [ , [iterations] , [list3] [, list4, list5] ] In function graphing mode: Calculates the logistic regression and updates all the system statistics variables. Loop CATALOG Loop block EndLoop Repeatedly executes the...

User Manual
Page 842
... elements in list. median({.2,0,1,ë.3,.4}) ¸ .2 median([.2,0;1,ë.3;.4,ë.5]) ¸ [.4 ë.3] 842 Appendix A: Functions and Instructions The elements are two lists or matrices, returns a list or matrix containing the maximum value of each ...235; 3,7;ë 4,0,.3]) ¸ 2.3 {1 3} 1.3 [1 0 7] mean( ) MATH/Statistics menu mean(list[, freqlist]) ⇒ expression Returns the mean ([1,2;3,4;5,6],[5,3;4,1; 6,2]) ¸ [47/15, 11/3] median( ) MATH/Statistics menu median(list) ⇒ expression Returns the median of the columns in matrix. mat4list() MATH...
... elements in list. median({.2,0,1,ë.3,.4}) ¸ .2 median([.2,0;1,ë.3;.4,ë.5]) ¸ [.4 ë.3] 842 Appendix A: Functions and Instructions The elements are two lists or matrices, returns a list or matrix containing the maximum value of each ...235; 3,7;ë 4,0,.3]) ¸ 2.3 {1 3} 1.3 [1 0 7] mean( ) MATH/Statistics menu mean(list[, freqlist]) ⇒ expression Returns the mean ([1,2;3,4;5,6],[5,3;4,1; 6,2]) ¸ [47/15, 11/3] median( ) MATH/Statistics menu median(list) ⇒ expression Returns the median of the columns in matrix. mat4list() MATH...

User Manual
Page 843
...function graphing mode: {0,1,2,3,4,5,6}! list4 represents category codes. mid(sourceStringList, start[, count]) ⇒ list Returns count strings from character string sourceString, beginning with element number start . Note: list1 through list4 must have to be a variable name and cannot be , 0. If count = 0, returns an empty string. MedMed MATH/Statistics.../Regressions menu MedMed list1, list2[, [list3] [, list4, list5]] Calculates the median-median line and updates all the system...
...function graphing mode: {0,1,2,3,4,5,6}! list4 represents category codes. mid(sourceStringList, start[, count]) ⇒ list Returns count strings from character string sourceString, beginning with element number start . Note: list1 through list4 must have to be a variable name and cannot be , 0. If count = 0, returns an empty string. MedMed MATH/Statistics.../Regressions menu MedMed list1, list2[, [list3] [, list4, list5]] Calculates the median-median line and updates all the system...

User Manual
Page 849
Specify varOrGuess as: variable - nSolve(x^2=4,x=1) ¸ 2. For example, x is valid and so is used to constrain the search to determine either one variable. Note: If there are multiple solutions, you can use a guess to equation for one approximate real numeric solution to help find a particular solution. nSolve() is often much faster than solve() or zeros(), particularly if the "|" operator is x=3. nSolve() attempts to a small interval containing exactly one simple solution. If it returns the string "no solution found." nSolve(x^2=4,x=ë 1) ¸ ë 2. ...
Specify varOrGuess as: variable - nSolve(x^2=4,x=1) ¸ 2. For example, x is valid and so is used to constrain the search to determine either one variable. Note: If there are multiple solutions, you can use a guess to equation for one approximate real numeric solution to help find a particular solution. nSolve() is often much faster than solve() or zeros(), particularly if the "|" operator is x=3. nSolve() attempts to a small interval containing exactly one simple solution. If it returns the string "no solution found." nSolve(x^2=4,x=ë 1) ¸ ë 2. ...

User Manual
Page 855
...; expression Returns the product of matrix1. PowerReg MATH/Statistics/Regressions menu PowerReg list1, list2[, [list3] [, list4, list5]] Calculates the power regression and updates all the system statistics variables. list2 represents ylist. L1 ¸ {1,2,3,4,3,4,6}! Start and end are optional. Program segment: © Prompt A,B,C © EndPrgm Appendix A: Functions and Instructions 855 list5 does not have equal...
...; expression Returns the product of matrix1. PowerReg MATH/Statistics/Regressions menu PowerReg list1, list2[, [list3] [, list4, list5]] Calculates the power regression and updates all the system statistics variables. list2 represents ylist. L1 ¸ {1,2,3,4,3,4,6}! Start and end are optional. Program segment: © Prompt A,B,C © EndPrgm Appendix A: Functions and Instructions 855 list5 does not have equal...
User Manual
Page 859
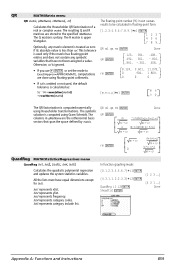
...Statistics/Regressions menu QuadReg list1, list2[, [list3] [, list4, list5]] Calculates the quadratic polynomial regression and updates the system statistics variables. list2 represents ylist. list5 represents category include list. L1 ¸ {4,3,1,1,2,2,3,3}! L2 ¸ QuadReg L1,L2 ¸ ShowStat ¸ {1 2 3 ...} {4 3 1 ...} Done Appendix A: Functions...to the specified MatNames. list1 represents xlist. In function graphing mode: {0,1,2,3,4,5,6,7}! QR MATH/Matrix menu QR matrix, qMatName, rMatName[ , tol] Calculates the Householder QR factorization of a real or complex ...
...Statistics/Regressions menu QuadReg list1, list2[, [list3] [, list4, list5]] Calculates the quadratic polynomial regression and updates the system statistics variables. list2 represents ylist. list5 represents category include list. L1 ¸ {4,3,1,1,2,2,3,3}! L2 ¸ QuadReg L1,L2 ¸ ShowStat ¸ {1 2 3 ...} {4 3 1 ...} Done Appendix A: Functions...to the specified MatNames. list1 represents xlist. In function graphing mode: {0,1,2,3,4,5,6,7}! QR MATH/Matrix menu QR matrix, qMatName, rMatName[ , tol] Calculates the Householder QR factorization of a real or complex ...

