

User Manual
Page 10
... OPS (Operations) Menu 184 The MATRX CPLX (Complex ) Menu 185 Using Mathematical Functions with Matrices 185 Chapter 14: Statistics 187 Statistical Analysis on the TI-86 188 Setting Up a Statistical Analysis 188 The STAT (Statistics) Menu 188 Entering Statistical Data 189 The LIST NAMES Menu 189 The STAT CALC (Calculations) Menu 189 Automatic Regression Equation Storage 191 Results of...
... OPS (Operations) Menu 184 The MATRX CPLX (Complex ) Menu 185 Using Mathematical Functions with Matrices 185 Chapter 14: Statistics 187 Statistical Analysis on the TI-86 188 Setting Up a Statistical Analysis 188 The STAT (Statistics) Menu 188 Entering Statistical Data 189 The LIST NAMES Menu 189 The STAT CALC (Calculations) Menu 189 Automatic Regression Equation Storage 191 Results of...
User Manual
Page 51
...♦ The first character must be a letter, which includes all CHAR GREEK menu items, as well as equation variables, list names, statistical result variables, window variables, and Ans. For example, ANS, Ans, and ans are introduced in the appropriate chapters. You cannot create ...; A user-created variable name cannot replicate a TI-86 feature symbol or built-in several types of data to a variable. ♦ Change TI-86 settings or reset defaults and memory to the factory settings. ♦ Execute functions that cause the TI-86 to store data automatically to built-in variables. ...
...♦ The first character must be a letter, which includes all CHAR GREEK menu items, as well as equation variables, list names, statistical result variables, window variables, and Ans. For example, ANS, Ans, and ans are introduced in the appropriate chapters. You cannot create ...; A user-created variable name cannot replicate a TI-86 feature symbol or built-in several types of data to a variable. ♦ Change TI-86 settings or reset defaults and memory to the factory settings. ♦ Execute functions that cause the TI-86 to store data automatically to built-in variables. ...
User Manual
Page 104
...previous values Recalculates yMin and yMax to display all statistical data points; the midpoint of the current graph (not the axes intersection) becomes the midpoint of the new graph Sets built-in window variables appropriate for trigonometric functions in Radian mode: xMin=L8.24668071567 xScl=1.5707963267949...=6.3, xScl=1, yMin=L3.1, yMax=3.1, and yScl=1 Sets window variable values to include the minimum and maximum y values of the selected functions between the current xMin and xMax Sets equal-size pixels on the axes; applies to user-defined zoom-window variables (ZRCL) ignores ...
...previous values Recalculates yMin and yMax to display all statistical data points; the midpoint of the current graph (not the axes intersection) becomes the midpoint of the new graph Sets built-in window variables appropriate for trigonometric functions in Radian mode: xMin=L8.24668071567 xScl=1.5707963267949...=6.3, xScl=1, yMin=L3.1, yMax=3.1, and yScl=1 Sets window variable values to include the minimum and maximum y values of the selected functions between the current xMin and xMax Sets equal-size pixels on the axes; applies to user-defined zoom-window variables (ZRCL) ignores ...
User Manual
Page 164
... 2™/CBL™) or Calculator-Based Ranger™ (CBR) and store it to a list name on the TI-86 (Chapter 18) ♦ Create lists dynamically using the LIST OPS menu item seq (page 159) On the TI-86, you can store in the TI-86 is a set of statistical data to analyze with statistical functions and plot on the graph...
... 2™/CBL™) or Calculator-Based Ranger™ (CBR) and store it to a list name on the TI-86 (Chapter 18) ♦ Create lists dynamically using the LIST OPS menu item seq (page 159) On the TI-86, you can store in the TI-86 is a set of statistical data to analyze with statistical functions and plot on the graph...
User Manual
Page 201
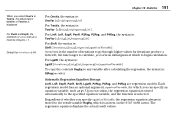
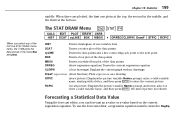
... (Chapter 11), or in the last statistical analysis The STAT CALC (Calculations) Menu - š & CALC EDIT PLOT DRAW VARS OneVa TwoVa LinR LnR ExpR 4 PwrR SinR LgstR P2Reg P3Reg OneVa TwoVa 4 P4Reg StReg (one variable) Analyzes data with one measured variable (two variable) Analyzes paired data TI-86 statistical functions use these lists as defaults. The...
... (Chapter 11), or in the last statistical analysis The STAT CALC (Calculations) Menu - š & CALC EDIT PLOT DRAW VARS OneVa TwoVa LinR LnR ExpR 4 PwrR SinR LgstR P2Reg P3Reg OneVa TwoVa 4 P4Reg StReg (one variable) Analyzes data with one measured variable (two variable) Analyzes paired data TI-86 statistical functions use these lists as defaults. The...
User Manual
Page 203
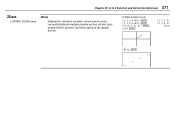
...,equationVariableä To copy the contents RegEq to any variable after calculating the regression, the syntax is selected. Upon execution, the regression equation is stored automatically to the specified equation variable, and the function is : StReg(variable) Automatic Regression Equation Storage LinR, LnR,... ExpR, PwrR, SinR, LgstR, P2Reg, P3Reg, and P4Reg are regression models. Regardless of whether you select OneVa or TwoVa, the abbreviation OneVar or TwoVar is displayed. Chapter 14: Statistics 191 ...
...,equationVariableä To copy the contents RegEq to any variable after calculating the regression, the syntax is selected. Upon execution, the regression equation is stored automatically to the specified equation variable, and the function is : StReg(variable) Automatic Regression Equation Storage LinR, LnR,... ExpR, PwrR, SinR, LgstR, P2Reg, P3Reg, and P4Reg are regression models. Regardless of whether you select OneVa or TwoVa, the abbreviation OneVar or TwoVar is displayed. Chapter 14: Statistics 191 ...
User Manual
Page 204
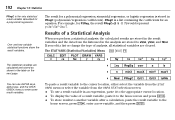
... in the table on the next page. The statistical variables are cleared. 192 Chapter 14: Statistics PRegC is the only statistical result variable calculated for an equation. One- Results of a Statistical Analysis When you edit a list or change the type of analysis, all statistical variables are calculated and stored as shown in an expression, paste ... the variable from the lists used in PRegC (polynomialàregression coefficients). PRegC is a list containing the coefficients for a polynomial regression. and two-variable statistical functions share the result variables.
... in the table on the next page. The statistical variables are cleared. 192 Chapter 14: Statistics PRegC is the only statistical result variable calculated for an equation. One- Results of a Statistical Analysis When you edit a list or change the type of analysis, all statistical variables are calculated and stored as shown in an expression, paste ... the variable from the lists used in PRegC (polynomialàregression coefficients). PRegC is a list containing the coefficients for a polynomial regression. and two-variable statistical functions share the result variables.
User Manual
Page 206
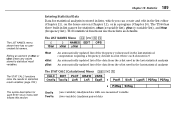
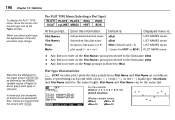
... plot types are scatter plot, xyLine, histogram, modified box plot, and regular box plot. ᕡ Store the statistical data in one , two, or three sets of statistical list data. Stat plot name OnàOff status Plot-type icon 1:Plot1...Off ® xStat yStat ›...icon Independent list name Dependent list name To change . Plotting Statistical Data You can plot one or more lists (Chapter 11). ᕢ Select or deselect functions in the current equation editor as appropriate (Chapter 5). ᕣ Define the statistical plot. ᕤ Turn on the plots you select another plot...
... plot types are scatter plot, xyLine, histogram, modified box plot, and regular box plot. ᕡ Store the statistical data in one , two, or three sets of statistical list data. Stat plot name OnàOff status Plot-type icon 1:Plot1...Off ® xStat yStat ›...icon Independent list name Dependent list name To change . Plotting Statistical Data You can plot one or more lists (Chapter 11). ᕢ Select or deselect functions in the current equation editor as appropriate (Chapter 5). ᕣ Define the statistical plot. ᕤ Turn on the plots you select another plot...
User Manual
Page 208
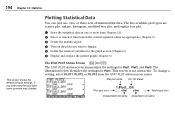
...=5 sin(xStat) Window variable values: xMin=0 yMin=L10 xMax=10 yMax=10 Some graph tools apply to stat plots. In these stat plot examples, all functions are displayed on the graph screen (6 *), as coordinate pairs, representing each point with :. Xlist Name and Ylist Name must be the same list. The PLOT...= prompt is stored to the list name xStat. ♦ Any list you enter at the Ylist Name= prompt is stored to fStat. 196 Chapter 14: Statistics To display the PLOT TYPE menu, move the cursor onto the plot type icon at the Freq= prompt is stored to the list name yStat...
...=5 sin(xStat) Window variable values: xMin=0 yMin=L10 xMax=10 yMax=10 Some graph tools apply to stat plots. In these stat plot examples, all functions are displayed on the graph screen (6 *), as coordinate pairs, representing each point with :. Xlist Name and Ylist Name must be the same list. The PLOT...= prompt is stored to the list name xStat. ♦ Any list you enter at the Ylist Name= prompt is stored to fStat. 196 Chapter 14: Statistics To display the PLOT TYPE menu, move the cursor onto the plot type icon at the Freq= prompt is stored to the list name yStat...
User Manual
Page 211
enter a valid variable name, starting with no drawings DrawF expression (draw function) Plots expression as a drawing STPIC (store picture) Displays the picture variable Name= prompt; select or enter a valid variable name, and then press b; To use the ... MBOX DRREG Draws a modified box plot of the first five STAT DRAW menu items, the TI-86 plots the data stored in the middle, and the third at the bottom. the stored picture is redrawn Forecasting a Statistical Data Value Using the forecast editor, you select any of the data points (draw regression equation...
enter a valid variable name, starting with no drawings DrawF expression (draw function) Plots expression as a drawing STPIC (store picture) Displays the picture variable Name= prompt; select or enter a valid variable name, and then press b; To use the ... MBOX DRREG Draws a modified box plot of the first five STAT DRAW menu items, the TI-86 plots the data stored in the middle, and the third at the bottom. the stored picture is redrawn Forecasting a Statistical Data Value Using the forecast editor, you select any of the data points (draw regression equation...
User Manual
Page 276
264 Chapter 20: A to Z Function and Instruction Reference aug 270 cnorm 273 cond 274 det 281 dim 281 ¶dim 281 eigVc 289 eigVl 289 Fill 295 ident 304 Matrices ... 293 fcstx 294 fcsty 294 Hist 303 LgstR 313 LinR 315 LnR 317 MBox 319 OneVar 327 P2Reg 330 P3Reg 331 P4Reg 332 PlOff 334 Statistics PlOn 334 Plot1 335 Plot2 335 Plot3 335 PwrR 339 rand 341 randBin 341 randInt 342 randM 342 randNorm 342 Scatter 349 Select 350 SetLEdit...
264 Chapter 20: A to Z Function and Instruction Reference aug 270 cnorm 273 cond 274 det 281 dim 281 ¶dim 281 eigVc 289 eigVl 289 Fill 295 ident 304 Matrices ... 293 fcstx 294 fcsty 294 Hist 303 LgstR 313 LinR 315 LnR 317 MBox 319 OneVar 327 P2Reg 330 P3Reg 331 P4Reg 332 PlOff 334 Statistics PlOn 334 Plot1 335 Plot2 335 Plot3 335 PwrR 339 rand 341 randBin 341 randInt 342 randM 342 randNorm 342 Scatter 349 Select 350 SetLEdit...
User Manual
Page 339
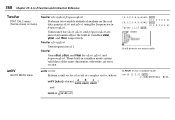
...Ans4Oct b 20Ý {7,8,9,10}4Oct b {7Ý 10Ý 11Ý 12Ý} {0,1,2,3,4,5,6}¶XL b {0 1 2 3 4 5 6} OneVar XL b Scroll down to Z Function and Instruction Reference 327 Oct † mode screen Oct Sets octal number base mode. OneVar STAT CALC menu (OneVa shows on menu) OneVar xList,frequencyList... Performs one-variable statistical analysis using the or Ý designator, respectively, from the BASE TYPE menu. 4Oct BASE CONV menu number 4Oct list 4Oct ...
...Ans4Oct b 20Ý {7,8,9,10}4Oct b {7Ý 10Ý 11Ý 12Ý} {0,1,2,3,4,5,6}¶XL b {0 1 2 3 4 5 6} OneVar XL b Scroll down to Z Function and Instruction Reference 327 Oct † mode screen Oct Sets octal number base mode. OneVar STAT CALC menu (OneVa shows on menu) OneVar xList,frequencyList... Performs one-variable statistical analysis using the or Ý designator, respectively, from the BASE TYPE menu. 4Oct BASE CONV menu number 4Oct list 4Oct ...
User Manual
Page 380
... ] and norm is (a2+b2+c2). {0,1,2,3,4,5,6}¶L1 b {0 1 2 3 4 5 6} {0,1,2,3,4,5,6}¶L2 b {0 1 2 3 4 5 6} TwoVar L1,L2 b Scroll down to Z Function and Instruction Reference TwoVar STAT CALC menu (TwoVa shows on menu) TwoVar xList,yList,frequencyList Performs two-variable statistical analysis on the real data pairs in xList and yList, using the frequencies in frequencyList. unitV...
... ] and norm is (a2+b2+c2). {0,1,2,3,4,5,6}¶L1 b {0 1 2 3 4 5 6} {0,1,2,3,4,5,6}¶L2 b {0 1 2 3 4 5 6} TwoVar L1,L2 b Scroll down to Z Function and Instruction Reference TwoVar STAT CALC menu (TwoVa shows on menu) TwoVar xList,yList,frequencyList Performs two-variable statistical analysis on the real data pairs in xList and yList, using the frequencies in frequencyList. unitV...
User Manual
Page 383
Chapter 20: A to Z Function and Instruction Reference 371 ZData † GRAPH ZOOM menu ZData Adjusts the window variable values based on the currently defined statistical plots so that all stat data points will be plotted, and then updates the graph screen. In Func graphing mode: {1,2,3,4}¶XL b {2,3,4,5}¶YL b Plot1(1,XL,YL) b ZStd b {1 2 3 4} {2 3 4 5} Done ZData b
Chapter 20: A to Z Function and Instruction Reference 371 ZData † GRAPH ZOOM menu ZData Adjusts the window variable values based on the currently defined statistical plots so that all stat data points will be plotted, and then updates the graph screen. In Func graphing mode: {1,2,3,4}¶XL b {2,3,4,5}¶YL b Plot1(1,XL,YL) b ZStd b {1 2 3 4} {2 3 4 5} Done ZData b
User Manual
Page 403
Appendix 391 Ñ, ñ, Ç, and ç are valid as the first letter of a variable name. %, ' , and ! can be functions. STAT PLOT Menu - š ( PLOT1 PLOT2 PLOT3 PlOn PlOff Plot Type Menu or ( ) # PLOT1 PLOT2 PLOT3 PlOn PlOff SCAT xyLINE MBOX HIST BOX Plot Mark ... PlOn PlOff › + ¦ STAT DRAW Menu - š ) CALC EDIT PLOT DRAW VARS HIST SCAT xyLINE BOX MBOX 4 DRREG CLDRW DrawF STPIC RCPIC STAT VARS (Statistical Result Variables) Menu - š * CALC EDIT PLOT DRAW VARS v sx Sx w sy 4 Sy Gx Gx2 Gy Gy2 4 Gxy RegEq corr a b 4 n minX maxX minY maxY 4 Med...
Appendix 391 Ñ, ñ, Ç, and ç are valid as the first letter of a variable name. %, ' , and ! can be functions. STAT PLOT Menu - š ( PLOT1 PLOT2 PLOT3 PlOn PlOff Plot Type Menu or ( ) # PLOT1 PLOT2 PLOT3 PlOn PlOff SCAT xyLINE MBOX HIST BOX Plot Mark ... PlOn PlOff › + ¦ STAT DRAW Menu - š ) CALC EDIT PLOT DRAW VARS HIST SCAT xyLINE BOX MBOX 4 DRREG CLDRW DrawF STPIC RCPIC STAT VARS (Statistical Result Variables) Menu - š * CALC EDIT PLOT DRAW VARS v sx Sx w sy 4 Sy Gx Gx2 Gy Gy2 4 Gxy RegEq corr a b 4 n minX maxX minY maxY 4 Med...
User Manual
Page 417
... variable), 193 L1 (inverse), 48, 309 ¶dim, 184, 281 ¶dimL, 282 ‰f(x) (function numerical integral), 96, 98 @Tbl (table step), 113 sx (statistical result variable), 193 Gx2 (statistical result variable), 193 sy (statistical result variable), 193 % (percent), 52, 334 < (less than), 55, 312 = (assign to), 270 = (equals), 290 == (relational equals), 55, 291...
... variable), 193 L1 (inverse), 48, 309 ¶dim, 184, 281 ¶dimL, 282 ‰f(x) (function numerical integral), 96, 98 @Tbl (table step), 113 sx (statistical result variable), 193 Gx2 (statistical result variable), 193 sy (statistical result variable), 193 % (percent), 52, 334 < (less than), 55, 312 = (assign to), 270 = (equals), 290 == (relational equals), 55, 291...
User Manual
Page 426
... PEN, 105 percent (%), 334 permutations of items, 50 pEval(, 52, 334 phone (TI Customer Support), 392 pi, 59 PIC (picture names), 43 PIC variable entering, 76 storing graph, 102 pictures recalling, 102 saving, 102 pixel resolution for function graphs, 81 PlOff (plot off), 195, 334 PlOn (plot on), 195, 334 ...PLOT1, 195 Plot1(, 335 PLOT2, 195 Plot2(, 335 PLOT3, 195 Plot3(, 335 plotting functions, 9, 11 plotting statistical data, 194 points drawing, 108 turning on and off, 108 Pol (polar mode), 35, 74, 239, 336 4Pol (to polar), 71, 174, 336 ...
... PEN, 105 percent (%), 334 permutations of items, 50 pEval(, 52, 334 phone (TI Customer Support), 392 pi, 59 PIC (picture names), 43 PIC variable entering, 76 storing graph, 102 pictures recalling, 102 saving, 102 pixel resolution for function graphs, 81 PlOff (plot off), 195, 334 PlOn (plot on), 195, 334 ...PLOT1, 195 Plot1(, 335 PLOT2, 195 Plot2(, 335 PLOT3, 195 Plot3(, 335 plotting functions, 9, 11 plotting statistical data, 194 points drawing, 108 turning on and off, 108 Pol (polar mode), 35, 74, 239, 336 4Pol (to polar), 71, 174, 336 ...
User Manual
Page 429
...360 square root (‡), 7, 360 St4Eq( (string to equation), 227, 361 STAT (statistical result variables), 43 STAT CALC (Calculations) menu, 189 STAT menu, 188 Stat Plot changing on/off status, 81 setting up,... (N), 363 sum, 52, 160, 364 sum of elements of list, 52 Sx (statistical result variable), 193 syntax error, 27 syntax of function, 25 syntax of instruction, 25 T T (transpose), 367 table, 110 clearing, 114... (table setup editor), 112, 113 TEST menu, 55 TEXT, 105 Text(, 366 Then, 218, 305, 306 TI-GRAPH LINK, 235 tMax, 127, 136 tMin, 127, 136 TOL (Tolerance Editor), 398 tPlot, 136 TRACE,...
...360 square root (‡), 7, 360 St4Eq( (string to equation), 227, 361 STAT (statistical result variables), 43 STAT CALC (Calculations) menu, 189 STAT menu, 188 Stat Plot changing on/off status, 81 setting up,... (N), 363 sum, 52, 160, 364 sum of elements of list, 52 Sx (statistical result variable), 193 syntax error, 27 syntax of function, 25 syntax of instruction, 25 T T (transpose), 367 table, 110 clearing, 114... (table setup editor), 112, 113 TEST menu, 55 TEXT, 105 Text(, 366 Then, 218, 305, 306 TI-GRAPH LINK, 235 tMax, 127, 136 tMin, 127, 136 TOL (Tolerance Editor), 398 tPlot, 136 TRACE,...

