
User Manual
Page 1
Copyright © 1997, 2001 by Texas Instruments Incorporated IBM is a registered trademark of International Business Machines Corporation Macintosh is a registered trademark of Apple Computer, Inc. Windows is a registered trademark of Microsoft Corporation. TI-86 GRAPHING CALCULATOR GUIDEBOOK TI-GRAPH LINK, Calculator-Based Laboratory, CBL, CBL 2, Calculator-Based Ranger, CBR, Constant Memory, Automatic Power Down, APD, and EOS are trademarks of Texas Instruments Incorporated.
Copyright © 1997, 2001 by Texas Instruments Incorporated IBM is a registered trademark of International Business Machines Corporation Macintosh is a registered trademark of Apple Computer, Inc. Windows is a registered trademark of Microsoft Corporation. TI-86 GRAPHING CALCULATOR GUIDEBOOK TI-GRAPH LINK, Calculator-Based Laboratory, CBL, CBL 2, Calculator-Based Ranger, CBR, Constant Memory, Automatic Power Down, APD, and EOS are trademarks of Texas Instruments Incorporated.

User Manual
Page 3
...a List with a Function 5 Displaying the Integer Part of Real Numbers in a List 6 Removing (Exiting) a Menu 6 Finding the Square Root 7 Calculating Derivatives 7 Retrieving, Editing, and Re-evaluating the Previous Entry 8 Converting Degrees Fahrenheit to Degrees Celsius 8 Storing an Unevaluated Expression to an Equation Variable ...Function 13 Zooming In on a Portion of the Graph Screen 14 Chapter 1: Operating the TI-86 15 Installing or Replacing Batteries 16 When to Replace Batteries 16 Turning On and Turning Off the TI-86 17 Adjusting the Display Contrast 17 The Home ...
...a List with a Function 5 Displaying the Integer Part of Real Numbers in a List 6 Removing (Exiting) a Menu 6 Finding the Square Root 7 Calculating Derivatives 7 Retrieving, Editing, and Re-evaluating the Previous Entry 8 Converting Degrees Fahrenheit to Degrees Celsius 8 Storing an Unevaluated Expression to an Equation Variable ...Function 13 Zooming In on a Portion of the Graph Screen 14 Chapter 1: Operating the TI-86 15 Installing or Replacing Batteries 16 When to Replace Batteries 16 Turning On and Turning Off the TI-86 17 Adjusting the Display Contrast 17 The Home ...

User Manual
Page 4
... 25 Using an Instruction 25 Entering Functions, Instructions, and Operators 25 Entering Consecutive Entries 26 The Busy Indicator 26 Interrupting a Calculation or Graph 26 Diagnosing an Error 27 Correcting an Error 27 Reusing Previous Entries and the Last Answer 28 Retrieving the Last Entry 28 ... 29 Clearing the ENTRY Storage Area 29 Retrieving the Last Answer 29 Using Ans Preceding a Function 30 Storing Results to a Variable 30 Using TI-86 Menus 31 Displaying a Menu 31 The Menu Keys 32 Selecting a Menu Item 32 Exiting (Removing) a Menu 33 Viewing and Changing Modes ...
... 25 Using an Instruction 25 Entering Functions, Instructions, and Operators 25 Entering Consecutive Entries 26 The Busy Indicator 26 Interrupting a Calculation or Graph 26 Diagnosing an Error 27 Correcting an Error 27 Reusing Previous Entries and the Last Answer 28 Retrieving the Last Entry 28 ... 29 Clearing the ENTRY Storage Area 29 Retrieving the Last Answer 29 Using Ans Preceding a Function 30 Storing Results to a Variable 30 Using TI-86 Menus 31 Displaying a Menu 31 The Menu Keys 32 Selecting a Menu Item 32 Exiting (Removing) a Menu 33 Viewing and Changing Modes ...

User Manual
Page 10
...Matrices 185 Chapter 14: Statistics 187 Statistical Analysis on the TI-86 188 Setting Up a Statistical Analysis 188 The STAT (Statistics) Menu 188 Entering Statistical Data 189 The LIST NAMES Menu 189 The STAT CALC (Calculations) Menu 189 Automatic Regression Equation Storage 191 Results of a... Bounds and a Guess 204 Editing the Equation 205 The Solver Menu 206 Solving for the Unknown Variable 206 Graphing the Solution 207 Solver Graph Tools 207 The Solver ZOOM Menu 208 The Simultaneous Equation Solver 208 Entering Equations to Solve Simultaneously 208 Storing...
...Matrices 185 Chapter 14: Statistics 187 Statistical Analysis on the TI-86 188 Setting Up a Statistical Analysis 188 The STAT (Statistics) Menu 188 Entering Statistical Data 189 The LIST NAMES Menu 189 The STAT CALC (Calculations) Menu 189 Automatic Regression Equation Storage 191 Results of a... Bounds and a Guess 204 Editing the Equation 205 The Solver Menu 206 Solving for the Unknown Variable 206 Graphing the Solution 207 Solver Graph Tools 207 The Solver ZOOM Menu 208 The Simultaneous Equation Solver 208 Entering Equations to Solve Simultaneously 208 Storing...
User Manual
Page 13
TI-86 Quick Start Preparing to Use Your New TI-86 2 Calculating on the Home Screen 3 Plotting Functions on the Graph Screen 9 TI -86 M1 M2 M3 M4 M5 F1 F2 F3 F4 F5
TI-86 Quick Start Preparing to Use Your New TI-86 2 Calculating on the Home Screen 3 Plotting Functions on the Graph Screen 9 TI -86 M1 M2 M3 M4 M5 F1 F2 F3 F4 F5

User Manual
Page 38
... each from left to the cursor location as the busy indicator in the top-right corner of the screen. The Busy Indicator When the TI-86 is calculating or graphing, a moving vertical line is replaced by the pause indicator, a moving vertical dotted line. w / / * & & b to...the last expression or instruction. 26 Chapter 1: Operating the TI-86 In the example, the ¶ symbol indicates that you pressed - Interrupting a Calculation or Graph To interrupt a calculation or graph in last entry (page 28). When you interrupt a calculation, the ERROR 06 BREAK message and menu are displayed. ...
... each from left to the cursor location as the busy indicator in the top-right corner of the screen. The Busy Indicator When the TI-86 is calculating or graphing, a moving vertical line is replaced by the pause indicator, a moving vertical dotted line. w / / * & & b to...the last expression or instruction. 26 Chapter 1: Operating the TI-86 In the example, the ¶ symbol indicates that you pressed - Interrupting a Calculation or Graph To interrupt a calculation or graph in last entry (page 28). When you interrupt a calculation, the ERROR 06 BREAK message and menu are displayed. ...

User Manual
Page 95
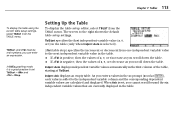
... are calculated from xMin, xMax, yMin, and yMax using these formulas: @x=(xMin+xMax)à126 @y=(yMin+yMax)à62 @x and @y are not on the mode screen. When you display a graph, the values of any adjacent pixel. Setting the Graph Format To display the graph format ...screen, select FORMT from the GRAPH menu (6 / (). The current settings are highlighted. The TI-86 retains independent format settings for changing a window variable ...
... are calculated from xMin, xMax, yMin, and yMax using these formulas: @x=(xMin+xMax)à126 @y=(yMin+yMax)à62 @x and @y are not on the mode screen. When you display a graph, the values of any adjacent pixel. Setting the Graph Format To display the graph format ...screen, select FORMT from the GRAPH menu (6 / (). The current settings are highlighted. The TI-86 retains independent format settings for changing a window variable ...

User Manual
Page 96
... the cursor coordinates at the bottom of the graph Does not display the cursor coordinates at the bottom of the graph Draws a line between the points calculated for the functions in the equation editor Plots only the calculated points for the functions in the equation editor (sequential graphing) Evaluates and plots one function completely before...
... the cursor coordinates at the bottom of the graph Does not display the cursor coordinates at the bottom of the graph Draws a line between the points calculated for the functions in the equation editor Plots only the calculated points for the functions in the equation editor (sequential graphing) Evaluates and plots one function completely before...

User Manual
Page 102
... cursor coordinates are displayed at an x value, then the y value is undefined at the bottom of the screen. If the function is blank. That is graphed. The trace cursor appears as if the cursor were still on the first selected function, at each corner. or " while tracing. Initially, the trace cursor... reverse order of the selected functions in the equation editor From one member to the left or right side of the screen during a trace, the TI-86 automatically changes the values of an independent variable value, an x= prompt is calculated from the GRAPH menu.
... cursor coordinates are displayed at an x value, then the y value is undefined at the bottom of the screen. If the function is blank. That is graphed. The trace cursor appears as if the cursor were still on the first selected function, at each corner. or " while tracing. Initially, the trace cursor... reverse order of the selected functions in the equation editor From one member to the left or right side of the screen during a trace, the TI-86 automatically changes the values of an independent variable value, an x= prompt is calculated from the GRAPH menu.

User Manual
Page 107
...all zoomwindow variables from the GRAPH ZOOM menu. To perform the GRAPH MATH operation, press # and $ to move to specify left bound, right bound, and guess, the accuracy of the values you specify will affect the length of time the TI-86 spends calculating the answer; The zoom-...window variables resume their standard default values when you select a GRAPH MATH operation, Smart Graph displays the current graph with the trace cursor. When a GRAPH MATH menu operation prompts you to the function.
...all zoomwindow variables from the GRAPH ZOOM menu. To perform the GRAPH MATH operation, press # and $ to move to specify left bound, right bound, and guess, the accuracy of the values you specify will affect the length of time the TI-86 spends calculating the answer; The zoom-...window variables resume their standard default values when you select a GRAPH MATH operation, Smart Graph displays the current graph with the trace cursor. When a GRAPH MATH menu operation prompts you to the function.
User Manual
Page 125
... values automatically in the x= prompt (x=value b), each value is a good practice to the right shows the default table setup settings. In DifEq graphing mode, it is added to the next independent variable value in the table. you scroll down the table. ♦ If @Tbl is set ...first column of x, q, or t decrease as you scroll down the table. As you cannot scroll beyond the six independent variable values that are calculated and displayed. When Ask is negative, then the values of the table, starting at TblStart. Indpnt: Ask displays an empty table. TblStart and...
... values automatically in the x= prompt (x=value b), each value is a good practice to the right shows the default table setup settings. In DifEq graphing mode, it is added to the next independent variable value in the table. you scroll down the table. ♦ If @Tbl is set ...first column of x, q, or t decrease as you scroll down the table. As you cannot scroll beyond the six independent variable values that are calculated and displayed. When Ask is negative, then the values of the table, starting at TblStart. Indpnt: Ask displays an empty table. TblStart and...

User Manual
Page 134
...the home screen returns a list of the graph screen. The GRAPH MATH Menu 6 / & MATH DRAW FORMT STGDB RCGDB DIST dyàdx dràdq ARC TANLN dràdq Finds the numerical derivative (slope) of a function at a point The distances calculated by DIST and ARC are independent of ...q. dyàdx and dràdq are distances in the rectangular coordinate plane. 122 Chapter 8: Polar Graphing The other GRAPH MATH menu items are the same as in Func graphing. Drawing on the graph for a Specified q When the...
...the home screen returns a list of the graph screen. The GRAPH MATH Menu 6 / & MATH DRAW FORMT STGDB RCGDB DIST dyàdx dràdq ARC TANLN dràdq Finds the numerical derivative (slope) of a function at a point The distances calculated by DIST and ARC are independent of ...q. dyàdx and dràdq are distances in the rectangular coordinate plane. 122 Chapter 8: Polar Graphing The other GRAPH MATH menu items are the same as in Func graphing. Drawing on the graph for a Specified q When the...

User Manual
Page 141
...is selected, r, q, and t are calculated from t. You can enter an expression at the bottom of the screen continue to reactivate the trace cursor. Moving the Trace Cursor to a t Value To move the trace cursor beyond the top or bottom of the graph screen, the coordinate values at the ...if CoordOn format is not (Chapter 6). When you enter the first digit, a t= prompt is displayed in Param graphing; In Param mode, ZFIT adjusts the graph screen in Func graphing. When you have graphed a family of tStep From one equation to another Press: " or ! # or $ If you enter must be...
...is selected, r, q, and t are calculated from t. You can enter an expression at the bottom of the screen continue to reactivate the trace cursor. Moving the Trace Cursor to a t Value To move the trace cursor beyond the top or bottom of the graph screen, the coordinate values at the ...if CoordOn format is not (Chapter 6). When you enter the first digit, a t= prompt is displayed in Param graphing; In Param mode, ZFIT adjusts the graph screen in Func graphing. When you have graphed a family of tStep From one equation to another Press: " or ! # or $ If you enter must be...

User Manual
Page 142
... item EVAL evaluates selected polar equations directly on a Parametric Graph The DRAW menu items work in Param graphing the same as described in Ans. and y-coordinate values of the xt equation at a point with respect to t The distances calculated by DIST and ARC are distances in this form: {xt1...(t) yt1(t) xt2(t) xt2(t) ...}. The GRAPH ZOOM menu items affect only the x window variables (xMin, xMax, and xScl) and the y ...
... item EVAL evaluates selected polar equations directly on a Parametric Graph The DRAW menu items work in Param graphing the same as described in Ans. and y-coordinate values of the xt equation at a point with respect to t The distances calculated by DIST and ARC are distances in this form: {xt1...(t) yt1(t) xt2(t) xt2(t) ...}. The GRAPH ZOOM menu items affect only the x window variables (xMin, xMax, and xScl) and the y ...

User Manual
Page 147
...) are not defined, but you cannot enter a list in Q'3, the calculator returns an error. Chapter 10: Differential Equation Graphing 135 In this editor, you to analyze each equation independently. Equations are not available in terms of selection status, starting at Q'1. When the TI-86 calculates a differential equation system, it references all equations in the equation...
...) are not defined, but you cannot enter a list in Q'3, the calculator returns an error. Chapter 10: Differential Equation Graphing 135 In this editor, you to analyze each equation independently. Equations are not available in terms of selection status, starting at Q'1. When the TI-86 calculates a differential equation system, it references all equations in the equation...

User Manual
Page 156
... Using Graph Tools in DifEq Graphing Mode The Free-Moving Cursor The free-moving cursor works in Func graphing. Tracing...to change appropriately. 144 Chapter 10: Differential Equation Graphing To paste ' to the home screen, you can...value). ♦ The equation must be stored to TI-86 system requirements, you trace an equation, the coordinates are... Value On the home screen in DifEq graphing mode, you can select it does in...The trace cursor moves in DifEq graphing; If t is not (Chapter 6). QuickZoom...as it from the CHAR MISC menu or from the GRAPH menu (6 / )). panning is not an axis, three...
... Using Graph Tools in DifEq Graphing Mode The Free-Moving Cursor The free-moving cursor works in Func graphing. Tracing...to change appropriately. 144 Chapter 10: Differential Equation Graphing To paste ' to the home screen, you can...value). ♦ The equation must be stored to TI-86 system requirements, you trace an equation, the coordinates are... Value On the home screen in DifEq graphing mode, you can select it does in...The trace cursor moves in DifEq graphing; If t is not (Chapter 6). QuickZoom...as it from the CHAR MISC menu or from the GRAPH menu (6 / )). panning is not an axis, three...
User Manual
Page 164
...Chapter 11: Lists The length and number of statistical data to analyze with the Calculator-Based Laboratory™ (CBL 2™/CBL™) or Calculator-Based Ranger™ (CBR) and store it to a list name on the TI-86 (Chapter 18) ♦ Create lists dynamically using the LIST OPS menu item seq...161) ♦ Collect data with statistical functions and plot on the TI-86 A list is limited only by memory capacity. To paste { or } to graph a family of curves (Chapter 5) ♦ As a set of elements. On the TI-86, you can store in the TI-86 is a set of lists you can : ♦ Enter a...
...Chapter 11: Lists The length and number of statistical data to analyze with the Calculator-Based Laboratory™ (CBL 2™/CBL™) or Calculator-Based Ranger™ (CBR) and store it to a list name on the TI-86 (Chapter 18) ♦ Create lists dynamically using the LIST OPS menu item seq...161) ♦ Collect data with statistical functions and plot on the TI-86 A list is limited only by memory capacity. To paste { or } to graph a family of curves (Chapter 5) ♦ As a set of elements. On the TI-86, you can store in the TI-86 is a set of lists you can : ♦ Enter a...

User Manual
Page 200
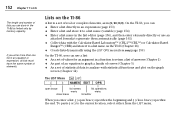
... Graph the regression equation for the independent variable values. When analyzing either kind of data, you can analyze one-variable and two-variable statistical data, which are stored in lists. These specified frequencies must be real numbers , 0. Statistical Analysis on the TI-86 With the TI-86,...Chapter 11. The STAT (Statistics) Menu - š CALC EDIT PLOT DRAW VARS 4 FCST statistical stat plot statistical result calculations menu variables menu menu list editor statistical drawing tools menu forecast editor Two-variable data has pairs comprising an independent variable and ...
... Graph the regression equation for the independent variable values. When analyzing either kind of data, you can analyze one-variable and two-variable statistical data, which are stored in lists. These specified frequencies must be real numbers , 0. Statistical Analysis on the TI-86 With the TI-86,...Chapter 11. The STAT (Statistics) Menu - š CALC EDIT PLOT DRAW VARS 4 FCST statistical stat plot statistical result calculations menu variables menu menu list editor statistical drawing tools menu forecast editor Two-variable data has pairs comprising an independent variable and ...

User Manual
Page 247
...cable into the port on the bottom edge of the calculator. ᕢ Firmly insert the other end of the unit-to many other device (or PC adapter). Chapter 18: The TI-86 Communication Link 235 Linking a TI-86 and a PC or Macintosh TI-86 TI-GRAPH LINKè is an optional system that add features... such as TI-83 finance and inferential statistics. The site also links to -unit cable into the...
...cable into the port on the bottom edge of the calculator. ᕢ Firmly insert the other end of the unit-to many other device (or PC adapter). Chapter 18: The TI-86 Communication Link 235 Linking a TI-86 and a PC or Macintosh TI-86 TI-GRAPH LINKè is an optional system that add features... such as TI-83 finance and inferential statistics. The site also links to -unit cable into the...
User Manual
Page 252
...calculator is ready to receive data, consult the TI-GRAPH LINK guidebook. If all selected items are displayed. Transmitting Data After you select data types on the sending unit and prepare the receiving unit to receive data transmission, select RECV from the menu (&). Preparing the Receiving Device To prepare a TI-86 or TI...-85 to receive data, you can begin transmitting, select XMIT on either calculator. 240 Chapter 18: The TI-86 Communication Link To prepare a PC to receive transmitted items....
...calculator is ready to receive data, consult the TI-GRAPH LINK guidebook. If all selected items are displayed. Transmitting Data After you select data types on the sending unit and prepare the receiving unit to receive data transmission, select RECV from the menu (&). Preparing the Receiving Device To prepare a TI-86 or TI...-85 to receive data, you can begin transmitting, select XMIT on either calculator. 240 Chapter 18: The TI-86 Communication Link To prepare a PC to receive transmitted items....


