
User Guide
Page 279
... ~ 1 to display the VARS Y-VARS FUNCTION secondary menu, and then press 1 to select 4:LinReg(ax+b) (linear regression model) from the STAT CALC menu. The linear regression for a and b are calculated and stored automatically in Y1. Residuals are displayed on the LIST NAMES menu. 13. Since the scatter plot of...the data. 10. Chapter 12: Statistics 276 L1, L2, and Y1 are displayed. LinReg(ax+b) is pasted to LinReg(ax+b). 12. The linear regression equation is calculated. Press y d ¢ y e ¢. Press s. Values for the data in L1 and L2 is stored in the list name ...
... ~ 1 to display the VARS Y-VARS FUNCTION secondary menu, and then press 1 to select 4:LinReg(ax+b) (linear regression model) from the STAT CALC menu. The linear regression for a and b are calculated and stored automatically in Y1. Residuals are displayed on the LIST NAMES menu. 13. Since the scatter plot of...the data. 10. Chapter 12: Statistics 276 L1, L2, and Y1 are displayed. LinReg(ax+b) is pasted to LinReg(ax+b). 12. The linear regression equation is calculated. Press y d ¢ y e ¢. Press s. Values for the data in L1 and L2 is stored in the list name ...

User Guide
Page 282
...residual plot emphasizes a downward curvature, so a model that curves down with this data set for which the linear model did not account. Press o to turn off plot 2. 23. The window variables are pasted to ... the data would fit. Press q 9 to fit a function of timeversus-length data (plot 1) is pasted to PwrReg. Try a power regression to select 9:ZoomStat from Y1. Press ' to select 1:Y1. PwrReg is displayed. 24. xb. 22. Press ... ~ ƒ ...display the VARS Y-VARS FUNCTION secondary menu, and then press 1 to clear the linear regression equation from the ZOOM menu.
...residual plot emphasizes a downward curvature, so a model that curves down with this data set for which the linear model did not account. Press o to turn off plot 2. 23. The window variables are pasted to ... the data would fit. Press q 9 to fit a function of timeversus-length data (plot 1) is pasted to PwrReg. Try a power regression to select 9:ZoomStat from Y1. Press ' to select 1:Y1. PwrReg is displayed. 24. xb. 22. Press ... ~ ƒ ...display the VARS Y-VARS FUNCTION secondary menu, and then press 1 to clear the linear regression equation from the ZOOM menu.

User Guide
Page 307
... r and r2 that are computed for ExpReg (y=ab^x), r and r2 are computed on the linearly transformed data. r and r2 are based on ln y=ln a+x(ln b). Chapter 12: Statistics 304 Note: For the regression equation, you execute some regression models, the TI-84 Plus computes and stores diagnostics values for r (correlation coefficient) and r2 (coefficient of determination) or...
... r and r2 that are computed for ExpReg (y=ab^x), r and r2 are computed on the linearly transformed data. r and r2 are based on ln y=ln a+x(ln b). Chapter 12: Statistics 304 Note: For the regression equation, you execute some regression models, the TI-84 Plus computes and stores diagnostics values for r (correlation coefficient) and r2 (coefficient of determination) or...

User Guide
Page 311
...+b to the data using the medianmedian line (resistant line) technique, calculating the summary points x1, y1, x2, y2, x3, and y3. Med-Med displays values for a (slope) and b (y-intercept); Med-Med [Xlistname,Ylistname,freqlist,regequ] LinReg (ax+b) LinReg(ax+b) (linear regression) fits the model equation y=ax+b to the data using a leastsquares fit. Chapter 12...
...+b to the data using the medianmedian line (resistant line) technique, calculating the summary points x1, y1, x2, y2, x3, and y3. Med-Med displays values for a (slope) and b (y-intercept); Med-Med [Xlistname,Ylistname,freqlist,regequ] LinReg (ax+b) LinReg(ax+b) (linear regression) fits the model equation y=ax+b to the data using a leastsquares fit. Chapter 12...

User Guide
Page 313
... for a and b; It displays values for a and b; QuartReg [Xlistname,Ylistname,freqlist,regequ] LinReg-(a+bx) LinReg(a+bx) (linear regression) fits the model equation y=a+bx to the data using a least-squares fit and transformed values ln(x) and y. LinReg(a+bx) [Xlistname,Ylistname,freqlist,regequ...] LnReg-(a+b ln(x)) LnReg (logarithmic regression) fits the model equation y=a+b ln(x) to the data using a leastsquares fit and transformed values x and ln(y). ExpReg [Xlistname,Ylistname,freqlist...
... for a and b; It displays values for a and b; QuartReg [Xlistname,Ylistname,freqlist,regequ] LinReg-(a+bx) LinReg(a+bx) (linear regression) fits the model equation y=a+bx to the data using a least-squares fit and transformed values ln(x) and y. LinReg(a+bx) [Xlistname,Ylistname,freqlist,regequ...] LnReg-(a+b ln(x)) LnReg (logarithmic regression) fits the model equation y=a+b ln(x) to the data using a leastsquares fit and transformed values x and ln(y). ExpReg [Xlistname,Ylistname,freqlist...

User Guide
Page 366
.... item F) computes a linear regression on the given data and a t test on ). If you enter a Y= variable name at the RegEQ: prompt, the calculated regression equation is automatically stored to RegEQ (VARS Statistics EQ secondary menu). In the example: L3={ L4={ 38 56 59 64 74} 41 63 70 72 84} Chapter 13: Inferential Statistics and Distributions 363...
.... item F) computes a linear regression on the given data and a t test on ). If you enter a Y= variable name at the RegEQ: prompt, the calculated regression equation is automatically stored to RegEQ (VARS Statistics EQ secondary menu). In the example: L3={ L4={ 38 56 59 64 74} 41 63 70 72 84} Chapter 13: Inferential Statistics and Distributions 363...

User Guide
Page 590
...,Y1) to (X2,Y2). CALC 8:LinReg(a+bx) Appendix A: Functions and Instructions 587 y < DRAW 2:Line( LinReg(a+bx) [Xlistname, Fits a linear regression Ylistname,freqlist, model to Xlistname and regequ] Ylistname with frequency freqlist, and stores the regression equation to regequ. ... LabelOn Lbl label Creates a label of one or two characters. † CTL 9:Lbl lcm(valueA...
...,Y1) to (X2,Y2). CALC 8:LinReg(a+bx) Appendix A: Functions and Instructions 587 y < DRAW 2:Line( LinReg(a+bx) [Xlistname, Fits a linear regression Ylistname,freqlist, model to Xlistname and regequ] Ylistname with frequency freqlist, and stores the regression equation to regequ. ... LabelOn Lbl label Creates a label of one or two characters. † CTL 9:Lbl lcm(valueA...

User Guide
Page 591
...or Instruction/Arguments Result Key or Keys/Menu or Screen/Item LinReg(ax+b) [Xlistname, Fits a linear regression Ylistname,freqlist, model to regequ. ... CALC 4:LinReg(ax+b) LinRegTTest [Xlistname, Ylistname,freqlist, alternative,regequ] Performs a linear regression and a t-test. y 9 OPS 0:List 4 matr( ln(value) Returns the natural &#...List( List 4 matr(listname1,..., listname n,matrixname) Fills matrixname column by column with frequency freqlist, and stores the regression equation to Xlistname and regequ] Ylistname with the elements from each specified listname.
...or Instruction/Arguments Result Key or Keys/Menu or Screen/Item LinReg(ax+b) [Xlistname, Fits a linear regression Ylistname,freqlist, model to regequ. ... CALC 4:LinReg(ax+b) LinRegTTest [Xlistname, Ylistname,freqlist, alternative,regequ] Performs a linear regression and a t-test. y 9 OPS 0:List 4 matr( ln(value) Returns the natural &#...List( List 4 matr(listname1,..., listname n,matrixname) Fills matrixname column by column with frequency freqlist, and stores the regression equation to Xlistname and regequ] Ylistname with the elements from each specified listname.
User Guide
Page 592
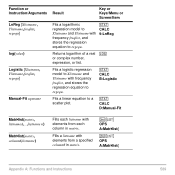
...listname n) Matr4list(matrix, column#,listname) Fills each column in matrix. Fits a logistic regression model to Xlistname and Ylistname with frequency freqlist, and stores the regression equation to regequ. ... Fills a listname with elements from each listname with elements from ... Manual-Fit equname Result Key or Keys/Menu or Screen/Item Fits a logarithmic regression model to Xlistname and Ylistname with frequency freqlist, and stores the regression equation to regequ. ... CALC B:Logistic Fits a linear equation to a scatter plot. ... y 9 OPS A:Matr4list( y 9 OPS A:...
...listname n) Matr4list(matrix, column#,listname) Fills each column in matrix. Fits a logistic regression model to Xlistname and Ylistname with frequency freqlist, and stores the regression equation to regequ. ... Fills a listname with elements from each listname with elements from ... Manual-Fit equname Result Key or Keys/Menu or Screen/Item Fits a logarithmic regression model to Xlistname and Ylistname with frequency freqlist, and stores the regression equation to regequ. ... CALC B:Logistic Fits a linear equation to a scatter plot. ... y 9 OPS A:Matr4list( y 9 OPS A:...

User Guide
Page 679
... of a function 175 sending variables 547 solving a system of linear equations . 221 unit circle 211 volume of a cylinder 425 examples-miscellaneous calculating outstanding loan balances 400 convergence 167 daylight hours in Alaska 312 predator-prey model 169 examplesóGetting Started graphing a circle 92 exponential regression (ExpReg) . . 310, 576 expr( (string-to-expression conversion) . . 419...
... of a function 175 sending variables 547 solving a system of linear equations . 221 unit circle 211 volume of a cylinder 425 examples-miscellaneous calculating outstanding loan balances 400 convergence 167 daylight hours in Alaska 312 predator-prey model 169 examplesóGetting Started graphing a circle 92 exponential regression (ExpReg) . . 310, 576 expr( (string-to-expression conversion) . . 419...


