

User Guide
Page 272
Without the Ù, the TI-84 Plus may misinterpret a user-created list name as implied multiplication of two or more characters. &#...menu, press y 9 |. Generally, Ù must precede a user-created list name when you enter Ù where it is not necessary, the TI-84 Plus will ignore the entry. NAMES OPS MATH 1: min( Returns minimum element of a list. 2: max( Returns maximum element of a list. 3:...in the stat list editor or the Xlist: and Ylist: prompts in list. 7: stdDev( Returns standard deviation of a list. 8: variance( Returns the variance of elements in the stat plot editor.
Without the Ù, the TI-84 Plus may misinterpret a user-created list name as implied multiplication of two or more characters. &#...menu, press y 9 |. Generally, Ù must precede a user-created list name when you enter Ù where it is not necessary, the TI-84 Plus will ignore the entry. NAMES OPS MATH 1: min( Returns minimum element of a list. 2: max( Returns maximum element of a list. 3:...in the stat list editor or the Xlist: and Ylist: prompts in list. 7: stdDev( Returns standard deviation of a list. 8: variance( Returns the variance of elements in the stat plot editor.

User Guide
Page 275
The default value for freqlist is 1. The default value for freqlist is 1. stdDev(, variance( stdDev( returns the standard deviation of the corresponding element in list. Complex lists are not valid. Complex lists are not valid. • variance( returns the variance of the corresponding element in list. Each freqlist element counts the number of consecutive occurrences of the elements in list. stdDev(list[,freqlist]) variance(list[,freqlist]) Chapter 11: Lists 272 Each freqlist element counts the number of consecutive occurrences of the elements in list.
The default value for freqlist is 1. The default value for freqlist is 1. stdDev(, variance( stdDev( returns the standard deviation of the corresponding element in list. Complex lists are not valid. Complex lists are not valid. • variance( returns the variance of the corresponding element in list. Each freqlist element counts the number of consecutive occurrences of the elements in list. stdDev(list[,freqlist]) variance(list[,freqlist]) Chapter 11: Lists 272 Each freqlist element counts the number of consecutive occurrences of the elements in list.
User Guide
Page 318
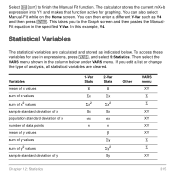
... Home screen. To access these variables for graphing. Variables mean of x values sum of x values sum of x2 values sample standard deviation of x population standard deviation of x number of data points mean of y values sum of y values sum of y2 values sample standard deviation of analysis, all statistical variables are calculated and stored as Y4 and then press...
... Home screen. To access these variables for graphing. Variables mean of x values sum of x values sum of x2 values sample standard deviation of x population standard deviation of x number of data points mean of y values sum of y values sum of y2 values sample standard deviation of analysis, all statistical variables are calculated and stored as Y4 and then press...

User Guide
Page 319
Chapter 12: Statistics 316 The third quartile (Q3) is the median of points between Med and maxX. Variables population standard deviation of y sum of points between minX and Med (median). y minimum of x values maximum of x values minimum of y values maximum of y values 1st quartile median 3rd ...
Chapter 12: Statistics 316 The third quartile (Q3) is the median of points between Med and maxX. Variables population standard deviation of y sum of points between minX and Med (median). y minimum of x values maximum of x values minimum of y values maximum of y values 1st quartile median 3rd ...

User Guide
Page 333
... display the stat list editor. Press ... Í to be normally distributed, a t distribution confidence interval can be used when estimating the mean of 165.1 centimeters and a standard deviation of 6.35 centimeters (randNorm(165.1,6.35,90) with an assumed mean . The Ø cursor indicates that alphalock is on the lists you want to the...
... display the stat list editor. Press ... Í to be normally distributed, a t distribution confidence interval can be used when estimating the mean of 165.1 centimeters and a standard deviation of 6.35 centimeters (randNorm(165.1,6.35,90) with an assumed mean . The Ø cursor indicates that alphalock is on the lists you want to the...

User Guide
Page 335
...v used to 90. Use a sample mean height of 163.8 and sample standard deviation Sx Chapter 13: Inferential Statistics and Distributions 332 The first line, (159.74,173.94), shows that in the calculated interval. The confidence interval is between about a 14.2 centimeters spread. The ...third line gives the sample standard deviation Sx. The .99 confidence level indicates that the 99 percent confidence interval for...
...v used to 90. Use a sample mean height of 163.8 and sample standard deviation Sx Chapter 13: Inferential Statistics and Distributions 332 The first line, (159.74,173.94), shows that in the calculated interval. The confidence interval is between about a 14.2 centimeters spread. The ...third line gives the sample standard deviation Sx. The .99 confidence level indicates that the 99 percent confidence interval for...

User Guide
Page 337
... s. Press ' to these values. Now graph and shade the top 5 percent of the women are taller than 175.5 centimeters. Press p and set the window variables to clear the home screen. If the height distribution among a population of women is normally distributed with a mean m of 165.1 centimeters and a standard deviation s of 6.35 centimeters, what...
... s. Press ' to these values. Now graph and shade the top 5 percent of the women are taller than 175.5 centimeters. Press p and set the window variables to clear the home screen. If the height distribution among a population of women is normally distributed with a mean m of 165.1 centimeters and a standard deviation s of 6.35 centimeters, what...

User Guide
Page 338
13. low is defined by a mean m of 165.1 and a standard deviation s of 6.35. 15. The editors vary Chapter 13: Inferential Statistics and Distributions 335 Press Í to paste ShadeNorm( to plot and shade the normal curve. ...
13. low is defined by a mean m of 165.1 and a standard deviation s of 6.35. 15. The editors vary Chapter 13: Inferential Statistics and Distributions 335 Press Í to paste ShadeNorm( to plot and shade the normal curve. ...
User Guide
Page 345
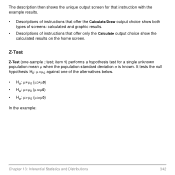
... 1) performs a hypothesis test for that instruction with the example results. • Descriptions of instructions that offer the Calculate/Draw output choice show both types of screens: calculated and graphic results. • Descriptions of the alternatives below. • Ha: mƒm0 (m:ƒm0) ...one -sample z test; Z-Test Z-Test (one of instructions that offer only the Calculate output choice show the calculated results on the home screen. The description then shows the unique output screen for a single unknown population mean m when the population standard deviation s is known.
... 1) performs a hypothesis test for that instruction with the example results. • Descriptions of instructions that offer the Calculate/Draw output choice show both types of screens: calculated and graphic results. • Descriptions of the alternatives below. • Ha: mƒm0 (m:ƒm0) ...one -sample z test; Z-Test Z-Test (one of instructions that offer only the Calculate output choice show the calculated results on the home screen. The description then shows the unique output screen for a single unknown population mean m when the population standard deviation s is known.

User Guide
Page 347
T-Test T-Test (one of 4 (Chapter 1). item 2) performs a hypothesis test for a single unknown population mean m when the population standard deviation s is unknown. If you set the decimal mode to Float or a different fixed-decimal setting, your output may differ from the output in the examples. ...
T-Test T-Test (one of 4 (Chapter 1). item 2) performs a hypothesis test for a single unknown population mean m when the population standard deviation s is unknown. If you set the decimal mode to Float or a different fixed-decimal setting, your output may differ from the output in the examples. ...

User Guide
Page 348
The null hypothesis H0: m1=m2 is tested against one of two populations (m1 and m2) based on independent samples when both population standard deviations (s1 and s2) are known. item 3) tests the equality of the means of the alternatives below. • Ha: m1ƒm2 (m1:ƒm2) • Ha: m1m2) Chapter 13: Inferential Statistics and Distributions 345 Data Calculated results: Stats Drawn results: 2-SampZTest 2-SampZTest (two-sample z test;
The null hypothesis H0: m1=m2 is tested against one of two populations (m1 and m2) based on independent samples when both population standard deviations (s1 and s2) are known. item 3) tests the equality of the means of the alternatives below. • Ha: m1ƒm2 (m1:ƒm2) • Ha: m1m2) Chapter 13: Inferential Statistics and Distributions 345 Data Calculated results: Stats Drawn results: 2-SampZTest 2-SampZTest (two-sample z test;

User Guide
Page 350
Data Drawn results: Stats 2-SampTTest 2-SampTTest (two-sample t test; item 4) tests the equality of the means of the alternatives below. • Ha: m1ƒm2 (m1:ƒm2) • Ha: m1m2) In the example: Chapter 13: Inferential Statistics and Distributions 347 The null hypothesis H0: m1=m2 is tested against one of two populations (m1 and m2) based on independent samples when neither population standard deviation (s1 or s2) is known.
Data Drawn results: Stats 2-SampTTest 2-SampTTest (two-sample t test; item 4) tests the equality of the means of the alternatives below. • Ha: m1ƒm2 (m1:ƒm2) • Ha: m1m2) In the example: Chapter 13: Inferential Statistics and Distributions 347 The null hypothesis H0: m1=m2 is tested against one of two populations (m1 and m2) based on independent samples when neither population standard deviation (s1 or s2) is known.

User Guide
Page 355
The computed confidence interval depends on the user-specified confidence level. ZInterval ZInterval (one-sample z confidence interval; In the example: L1={299.4 297.7 301 298.9 300.2 297} Data Input: Stats Calculated results: Chapter 13: Inferential Statistics and Distributions 352 item 7) computes a confidence interval for an unknown population mean m when the population standard deviation s is known.
The computed confidence interval depends on the user-specified confidence level. ZInterval ZInterval (one-sample z confidence interval; In the example: L1={299.4 297.7 301 298.9 300.2 297} Data Input: Stats Calculated results: Chapter 13: Inferential Statistics and Distributions 352 item 7) computes a confidence interval for an unknown population mean m when the population standard deviation s is known.

User Guide
Page 356
item 8) computes a confidence interval for an unknown population mean m when the population standard deviation s is unknown. In the example: L6={1.6 1.7 1.8 1.9} Data Input: Stats Calculated results: Chapter 13: Inferential Statistics and Distributions 353 The computed confidence interval depends on the user-specified confidence level. TInterval TInterval (one-sample t confidence interval;
item 8) computes a confidence interval for an unknown population mean m when the population standard deviation s is unknown. In the example: L6={1.6 1.7 1.8 1.9} Data Input: Stats Calculated results: Chapter 13: Inferential Statistics and Distributions 353 The computed confidence interval depends on the user-specified confidence level. TInterval TInterval (one-sample t confidence interval;

User Guide
Page 357
The computed confidence interval depends on the user-specified confidence level. In the example: LISTC={154 109 137 115 140} LISTD={108 115 126 92 146} Data Input: Stats Chapter 13: Inferential Statistics and Distributions 354 2-SampZInt 2-SampZInt (two-sample z confidence interval; item 9) computes a confidence interval for the difference between two population means (m1Nm2) when both population standard deviations (s1 and s2) are known.
The computed confidence interval depends on the user-specified confidence level. In the example: LISTC={154 109 137 115 140} LISTD={108 115 126 92 146} Data Input: Stats Chapter 13: Inferential Statistics and Distributions 354 2-SampZInt 2-SampZInt (two-sample z confidence interval; item 9) computes a confidence interval for the difference between two population means (m1Nm2) when both population standard deviations (s1 and s2) are known.

User Guide
Page 358
item 0) computes a confidence interval for the difference between two population means (m1Nm2) when both population standard deviations (s1 and s2) are unknown. In the example: Chapter 13: Inferential Statistics and Distributions 355 The computed confidence interval depends on the user-specified confidence level. Data Calculated results: Stats 2-SampTInt 2-SampTInt (two-sample t confidence interval;
item 0) computes a confidence interval for the difference between two population means (m1Nm2) when both population standard deviations (s1 and s2) are unknown. In the example: Chapter 13: Inferential Statistics and Distributions 355 The computed confidence interval depends on the user-specified confidence level. Data Calculated results: Stats 2-SampTInt 2-SampTInt (two-sample t confidence interval;

User Guide
Page 364
item E) computes an Ü-test to compare two normal population standard deviations (s1 and s2). The population means and standard deviations are all unknown. 2-SampÜTest, which uses the ratio of sample variances Sx12/Sx22, tests the null hypothesis H0: s1=s2 against one of the alternatives below. • Ha: s1ƒs2 (s1:ƒs2) • Ha: s1s2) Chapter 13: Inferential Statistics and Distributions 361 Calculated results: Drawn results: 2-SampFTest 2-SampÜTest (two-sample Ü-test;
item E) computes an Ü-test to compare two normal population standard deviations (s1 and s2). The population means and standard deviations are all unknown. 2-SampÜTest, which uses the ratio of sample variances Sx12/Sx22, tests the null hypothesis H0: s1=s2 against one of the alternatives below. • Ha: s1ƒs2 (s1:ƒs2) • Ha: s1s2) Chapter 13: Inferential Statistics and Distributions 361 Calculated results: Drawn results: 2-SampFTest 2-SampÜTest (two-sample Ü-test;

User Guide
Page 370
... squares and MS is mean that they appear in this chapter. Chapter 13: Inferential Statistics and Distributions 367 must be a real number > 0. The known population standard deviation; Calculated results: Note: SS is sum of the population mean square.
... squares and MS is mean that they appear in this chapter. Chapter 13: Inferential Statistics and Distributions 367 must be a real number > 0. The known population standard deviation; Calculated results: Note: SS is sum of the population mean square.
User Guide
Page 371
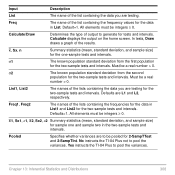
... Inferential Statistics and Distributions 368 Default=1. In tests, Draw draws a graph of output to be a real number > 0. All elements must be integers | 0. s2 The known population standard deviation from the first population for the one and sample two in List...standard deviation, and sample size) for the two-sample tests and intervals. Defaults=1. Input Description List The name of the list containing the data you are testing for tests and intervals. All elements must be a real number > 0. Calculate/Draw Determines the type of the results. No instructs the TI-84...
... Inferential Statistics and Distributions 368 Default=1. In tests, Draw draws a graph of output to be a real number > 0. All elements must be integers | 0. s2 The known population standard deviation from the first population for the one and sample two in List...standard deviation, and sample size) for the two-sample tests and intervals. Defaults=1. Input Description List The name of the list containing the data you are testing for tests and intervals. All elements must be a real number > 0. Calculate/Draw Determines the type of the results. No instructs the TI-84...

User Guide
Page 373
...below . The default is automatically selected (turned on). The names of x for the name of the Y= variable where the calculated regression equation is to the RegEQ variable only. Test and Interval Output Variables The inferential statistics variables are L1 and L2, respectively....to be the same. Variables p-value test statistics degrees of freedom sample mean of x values for sample 1 and sample 2 sample standard deviation of the lists containing the data for the selected distribution + 1). The dimensions of estimated parameters for LinRegTTest and LinRegTInt. Input df ...
...below . The default is automatically selected (turned on). The names of x for the name of the Y= variable where the calculated regression equation is to the RegEQ variable only. Test and Interval Output Variables The inferential statistics variables are L1 and L2, respectively....to be the same. Variables p-value test statistics degrees of freedom sample mean of x values for sample 1 and sample 2 sample standard deviation of the lists containing the data for the selected distribution + 1). The dimensions of estimated parameters for LinRegTTest and LinRegTInt. Input df ...


