Guidebook
Page 30
... Entry Again After you have pasted the last entry to the home screen and edited it (if you chose to edit it cannot be placed in ENTRY. Chapter 1: Operating the TI-84 Plus Silver Edition 23 Because the TI-84 Plus updates ENTRY only when you press Í, you can recall the previous entry even... is retained for ENTRY, but it ), you have begun to enter the next expression. 5 Ã 7 Í y [ Accessing a Previous Entry The TI-84 Plus retains as many previous entries as possible in ENTRY, up to ENTRY two or more expressions or instructions, separate each expression or instruction with a colon...
... Entry Again After you have pasted the last entry to the home screen and edited it (if you chose to edit it cannot be placed in ENTRY. Chapter 1: Operating the TI-84 Plus Silver Edition 23 Because the TI-84 Plus updates ENTRY only when you press Í, you can recall the previous entry even... is retained for ENTRY, but it ), you have begun to enter the next expression. 5 Ã 7 Í y [ Accessing a Previous Entry The TI-84 Plus retains as many previous entries as possible in ENTRY, up to ENTRY two or more expressions or instructions, separate each expression or instruction with a colon...
Guidebook
Page 51
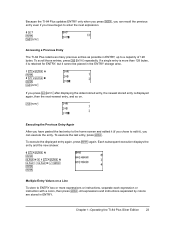
Edit bound={lower,upper}. The default is calculated as (---u---p----p---e---r----+-----l--o---w-----e---r--)- . 2 4. Move the cursor to the variable for which you want to solve and press ƒ \. • The solution is displayed next to the variable for which the TI-84 Plus searches for equations with multiple roots, the TI-84 Plus will attempt to see the exponent. • The values of...
Edit bound={lower,upper}. The default is calculated as (---u---p----p---e---r----+-----l--o---w-----e---r--)- . 2 4. Move the cursor to the variable for which you want to solve and press ƒ \. • The solution is displayed next to the variable for which the TI-84 Plus searches for equations with multiple roots, the TI-84 Plus will attempt to see the exponent. • The values of...
Guidebook
Page 52
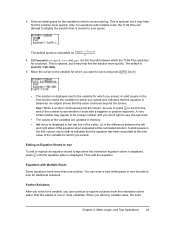
... and press ƒ \. To control that process, enter bounds that are relatively close to find a solution more quickly. The default for Solver or solve( The TI-84 Plus solves equations through an iterative process. MATH NUM CPX PRB 1: abs( Absolute value 2: round( Round 3: iPart( Integer part Chapter 2: Math, Angle, and Test Operations 45... bounds. solve( is valid only for lower is available only from CATALOG or from a Program The function solve( is L1â99. guess may be updated in list format.
... and press ƒ \. To control that process, enter bounds that are relatively close to find a solution more quickly. The default for Solver or solve( The TI-84 Plus solves equations through an iterative process. MATH NUM CPX PRB 1: abs( Absolute value 2: round( Round 3: iPart( Integer part Chapter 2: Math, Angle, and Test Operations 45... bounds. solve( is valid only for lower is available only from CATALOG or from a Program The function solve( is L1â99. guess may be updated in list format.

Guidebook
Page 82
... Y are displayed. If ExprOff format is selected, the function number is selected, R and q are displayed. • PolarGC updates X, Y, R, and q; Format settings define a graph's appearance on ) displays the cursor coordinates at the bottom of the graph. CoordOff (coordinates off or on. Format settings apply to select the highlighted setting. Sets expression display on or...
... Y are displayed. If ExprOff format is selected, the function number is selected, R and q are displayed. • PolarGC updates X, Y, R, and q; Format settings define a graph's appearance on ) displays the cursor coordinates at the bottom of the graph. CoordOff (coordinates off or on. Format settings apply to select the highlighted setting. Sets expression display on or...

Guidebook
Page 83
... plots. If you can pause or stop ; Pausing or Stopping a Graph While plotting a graph, you performed any of the following actions since the graph was last displayed, the TI-84 Plus will replot the graph based on . When ExprOff and CoordOn both are updated. As the TI-84 Plus plots the graph, the busy indicator is being traced. then press Í to...
... plots. If you can pause or stop ; Pausing or Stopping a Graph While plotting a graph, you performed any of the following actions since the graph was last displayed, the TI-84 Plus will replot the graph based on . When ExprOff and CoordOn both are updated. As the TI-84 Plus plots the graph, the busy indicator is being traced. then press Í to...

Guidebook
Page 86
... Y value is calculated from function to function, press † and }. Moving the Trace Cursor from Function to change appropriately. You can enter an expression at the bottom of the screen continue to Function To move the trace cursor from the X value; Chapter 3: Function Graphing 79 If ExprOn format...function, enter the value. The value must be valid for the current viewing window. The trace cursor moves to stat plots. that is updated. The cursor follows the order of the selected functions in the bottom-left corner of the screen, the coordinate values at the X= prompt...
... Y value is calculated from function to function, press † and }. Moving the Trace Cursor from Function to change appropriately. You can enter an expression at the bottom of the screen continue to Function To move the trace cursor from the X value; Chapter 3: Function Graphing 79 If ExprOn format...function, enter the value. The value must be valid for the current viewing window. The trace cursor moves to stat plots. that is updated. The cursor follows the order of the selected functions in the bottom-left corner of the screen, the coordinate values at the X= prompt...

Guidebook
Page 87
...of the screen, the viewing window automatically pans to the left TRACE, unless Smart Graph has replotted the graph. After Quick Zoom, the cursor remains in trig window variables. As you trace, the cursor coordinate values are updated to correspond to the new viewing window. Sets @X and @Y to define the viewing... Í to adjust the viewing window so that is above or below the display. Sets the built-in TRACE. Xmin and Xmax are updated. Magnifies the graph around the cursor. This allows panning up and down. When the instruction is encountered during program execution, the...
...of the screen, the viewing window automatically pans to the left TRACE, unless Smart Graph has replotted the graph. After Quick Zoom, the cursor remains in trig window variables. As you trace, the cursor coordinate values are updated to correspond to the new viewing window. Sets @X and @Y to define the viewing... Í to adjust the viewing window so that is above or below the display. Sets the built-in TRACE. Xmin and Xmax are updated. Magnifies the graph around the cursor. This allows panning up and down. When the instruction is encountered during program execution, the...

Guidebook
Page 89
... replots the functions immediately. change as shown below. Press Í. The TI-83 Plus adjusts the viewing window by XFact and YFact; ZDecimal ZDecimal replots the functions immediately. Xscl and Yscl remain unchanged. updates the window variables; To zoom out on the graph again in either of two ways. • To zoom in at...
... replots the functions immediately. change as shown below. Press Í. The TI-83 Plus adjusts the viewing window by XFact and YFact; ZDecimal ZDecimal replots the functions immediately. Xscl and Yscl remain unchanged. updates the window variables; To zoom out on the graph again in either of two ways. • To zoom in at...

Guidebook
Page 90
.... XMin and XMax are adjusted. ZoomFit recalculates YMin and YMax to the standard values shown below. ZQuadrant1 ZQuandrant1 replots the function immediately. It updates the window variables to include the minimum and maximum Y values of the new window, and then press Í; To use ZInteger, move ... replots the functions. @X=1 @Y=1 Xscl=10 Yscl=10 ZoomStat ZoomStat redefines the viewing window so that only quadrant 1 is displayed. Chapter 3: Function Graphing 83 Those preset values in Radian mode are displayed. ZStandard ZStandard replots the functions immediately.
.... XMin and XMax are adjusted. ZoomFit recalculates YMin and YMax to the standard values shown below. ZQuadrant1 ZQuandrant1 replots the function immediately. It updates the window variables to include the minimum and maximum Y values of the new window, and then press Í; To use ZInteger, move ... replots the functions. @X=1 @Y=1 Xscl=10 Yscl=10 ZoomStat ZoomStat redefines the viewing window so that only quadrant 1 is displayed. Chapter 3: Function Graphing 83 Those preset values in Radian mode are displayed. ZStandard ZStandard replots the functions immediately.

Guidebook
Page 91
... to 1/2 and set the X and Y value of each pixel to preset values, as shown below . It updates the window variables to one decimal place. It updates the window variables to preset values, as shown below . It updates the window variables to preset values, as shown below . Xmin=L47/2 Xmax=47/2 Xscl=1 Ymin=L31... set the X and Y value of each pixel to preset values, as shown below . Xmin=L47/5 Xmax=47/5 Xscl=1 Ymin=L31/5 Ymax=31/5 Yscl=1 Chapter 3: Function Graphing 84 It updates the window variables to one decimal place.
... to 1/2 and set the X and Y value of each pixel to preset values, as shown below . It updates the window variables to one decimal place. It updates the window variables to preset values, as shown below . It updates the window variables to preset values, as shown below . Xmin=L47/2 Xmax=47/2 Xscl=1 Ymin=L31... set the X and Y value of each pixel to preset values, as shown below . Xmin=L47/5 Xmax=47/5 Xscl=1 Ymin=L31/5 Ymax=31/5 Yscl=1 Chapter 3: Function Graphing 84 It updates the window variables to one decimal place.

Guidebook
Page 92
...and @Y equal to 1/10 and set the X and Y value of the current window variables are stored in Par mode. ZPrevious ZPrevious replots the graph using the window variables of ZXmin in Func mode also changes it in the user-defined ZOOM variables ZXmin, ZXmax, ZXscl, ZYmin, ZYmax, ZYscl,... Zoom Out factors. The graph is displayed, and the values of each pixel to preset values, as shown below . For example, changing the value of the graph that was displayed before you executed the last ZOOM instruction. It updates the window variables to all graphing modes. Stores the user-...
...and @Y equal to 1/10 and set the X and Y value of the current window variables are stored in Par mode. ZPrevious ZPrevious replots the graph using the window variables of ZXmin in Func mode also changes it in the user-defined ZOOM variables ZXmin, ZXmax, ZXscl, ZYmin, ZYmax, ZYscl,... Zoom Out factors. The graph is displayed, and the values of each pixel to preset values, as shown below . For example, changing the value of the graph that was displayed before you executed the last ZOOM instruction. It updates the window variables to all graphing modes. Stores the user-...

Guidebook
Page 93
Chapter 3: Function Graphing 86 ZOOM FACTORS The zoom factors, XFact and YFact, are positive numbers (not necessarily integers)... value is plotted. The user-defined viewing window is determined by the values stored with the user-defined values, and the graph is cleared automatically when you enter the first digit. • Place the cursor on the digit you can change , and...a program, you can store directly to delete it. The window variables are the defaults. ZoomRcl ZoomRcl graphs the selected functions in either of the user-defined ZOOM variables. The values shown are...
Chapter 3: Function Graphing 86 ZOOM FACTORS The zoom factors, XFact and YFact, are positive numbers (not necessarily integers)... value is plotted. The user-defined viewing window is determined by the values stored with the user-defined values, and the graph is cleared automatically when you enter the first digit. • Place the cursor on the digit you can change , and...a program, you can store directly to delete it. The window variables are the defaults. ZoomRcl ZoomRcl graphs the selected functions in either of the user-defined ZOOM variables. The values shown are...

Guidebook
Page 102
In PolarGC format, X, Y, R, and q are displayed. As the graph is selected, X and Y are updated. if CoordOn format is plotted, X, Y, and T are displayed. Chapter 4: Parametric Graphing 95 Displaying a Graph When you press s, the TI-84 Plus plots the selected parametric equations. In RectGC format, moving cursor in parametric graphing works the same as in intervals of Tstep), and then plots...
In PolarGC format, X, Y, R, and q are displayed. As the graph is selected, X and Y are updated. if CoordOn format is plotted, X, Y, and T are displayed. Chapter 4: Parametric Graphing 95 Displaying a Graph When you press s, the TI-84 Plus plots the selected parametric equations. In RectGC format, moving cursor in parametric graphing works the same as in intervals of Tstep), and then plots...
Guidebook
Page 103
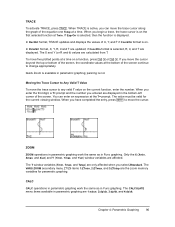
..., and Yscl) window variables are displayed in the bottom-left corner of X, Y, and T if CoordOn format is available in Func graphing. The CALCULATE menu items available in Func graphing. In RectGC format, TRACE updates and displays the values of the screen. The X and Y (or R and q) values are 1:value, 2:dy/dx, 3:dy/dt, and 4:dx...
..., and Yscl) window variables are displayed in the bottom-left corner of X, Y, and T if CoordOn format is available in Func graphing. The CALCULATE menu items available in Func graphing. In RectGC format, TRACE updates and displays the values of the screen. The X and Y (or R and q) values are 1:value, 2:dy/dx, 3:dy/dt, and 4:dx...

Guidebook
Page 106
... Spacing between the Y tick marks Note: To ensure that sufficient points are updated. Chapter 5: Polar Graphing 99 As the graph is plotted, X, Y, R, and q are plotted, you press s, the TI-84 Plus plots the selected polar equations. These variables define the viewing window. Displaying a Graph When you may want to qmax in intervals of qstep) and then plots...
... Spacing between the Y tick marks Note: To ensure that sufficient points are updated. Chapter 5: Polar Graphing 99 As the graph is plotted, X, Y, R, and q are plotted, you press s, the TI-84 Plus plots the selected polar equations. These variables define the viewing window. Displaying a Graph When you may want to qmax in intervals of qstep) and then plots...

Guidebook
Page 107
... of the equation one qstep at qmin. if CoordOn format is selected, X and Y are displayed. if CoordOn format is available in Func graphing. In RectGC format, TRACE updates the values of the screen. To move the trace cursor beyond the top or bottom of the screen, the coordinate values at the... bottom of the screen continue to move the trace cursor along the graph of X and Y; Quick Zoom is selected, R and q are displayed. In RectGC...
... of the equation one qstep at qmin. if CoordOn format is selected, X and Y are displayed. if CoordOn format is available in Func graphing. In RectGC format, TRACE updates the values of the screen. To move the trace cursor beyond the top or bottom of the screen, the coordinate values at the... bottom of the screen continue to move the trace cursor along the graph of X and Y; Quick Zoom is selected, R and q are displayed. In RectGC...

Guidebook
Page 111
..., the new value for nMin is the sequence window variable that defines the minimum n value to evaluate. Selecting Graph Styles The icons to u(nMin), v(nMin), and w(nMin), which is updated in Chapter 3 for u(n), v(n), and w(n). Dot, ç (line), and è (thick) styles are...which shows discrete values. Generally, sequences are ignored in the window editor. Selecting and Deselecting Sequence Functions The TI-84 Plus graphs only the selected sequence functions. Defining and Editing a Sequence Function To define or edit a sequence function, follow the steps in both editors.
..., the new value for nMin is the sequence window variable that defines the minimum n value to evaluate. Selecting Graph Styles The icons to u(nMin), v(nMin), and w(nMin), which is updated in Chapter 3 for u(n), v(n), and w(n). Dot, ç (line), and è (thick) styles are...which shows discrete values. Generally, sequences are ignored in the window editor. Selecting and Deselecting Sequence Functions The TI-84 Plus graphs only the selected sequence functions. Defining and Editing a Sequence Function To define or edit a sequence function, follow the steps in both editors.

Guidebook
Page 114
... x-axis n u(nN1), v(nN1), w(nN1) u(n) v(n) u(n) y-axis u(n), v(n), w(n) u(n), v(n), w(n) v(n) w(n) w(n) Displaying a Sequence Graph To plot the selected sequence functions, press s. As a graph is available only in detail. Time Web uv RectGC CoordOn GridOff AxesOn LableOff ExprOn vw uw Polar GC CoordOff GridOn AxesOff LabelOn...updates the values of sequence plot (axes) Rectangular or polar output Cursor coordinate display on/off Grid display off or on Axes display on or off Axes label display off or on Expression display on the top line of the screen is plotted, the TI-84 Plus updates...
... x-axis n u(nN1), v(nN1), w(nN1) u(n) v(n) u(n) y-axis u(n), v(n), w(n) u(n), v(n), w(n) v(n) w(n) w(n) Displaying a Sequence Graph To plot the selected sequence functions, press s. As a graph is available only in detail. Time Web uv RectGC CoordOn GridOff AxesOn LableOff ExprOn vw uw Polar GC CoordOff GridOn AxesOff LabelOn...updates the values of sequence plot (axes) Rectangular or polar output Cursor coordinate display on/off Grid display off or on Axes display on or off Axes label display off or on Expression display on the top line of the screen is plotted, the TI-84 Plus updates...

Guidebook
Page 115
... example, to quickly return the cursor to the beginning of the cursor helps identify points with attracting and repelling behavior in Func graphing. The value must be valid for Seq graphing. In PolarGC format, X, Y, R, and q are affected. When Time, uv, vw, or uw axes format is selected, R ... Trace Cursor to all directions. Only the X (Xmin, Xmax, and Xscl) and Y (Ymin, Ymax, and Yscl) window variables are updated; Chapter 6: Sequence Graphing 108 TRACE The axes format setting affects TRACE. When you enter the first digit, an n= prompt and the number you have moved the trace...
... example, to quickly return the cursor to the beginning of the cursor helps identify points with attracting and repelling behavior in Func graphing. The value must be valid for Seq graphing. In PolarGC format, X, Y, R, and q are affected. When Time, uv, vw, or uw axes format is selected, R ... Trace Cursor to all directions. Only the X (Xmin, Xmax, and Xscl) and Y (Ymin, Ymax, and Yscl) window variables are updated; Chapter 6: Sequence Graphing 108 TRACE The axes format setting affects TRACE. When you enter the first digit, an n= prompt and the number you have moved the trace...

Guidebook
Page 124
... from the Table Editor To edit a selected Y= function from the Y= Editor In the Y= editor, enter the functions that defines a dependent variable without having to view the function that define the ...are displayed in the Y= editor are calculated. Press } until the cursor is used. Edit the function. 4. Defining the Dependent Variables Defining Dependent Variables from the table editor, follow these steps. 1. Chapter 7: Tables 117 The current graphing mode is on the bottom line. 3. The table and the Y= function are updated automatically. Press y 0 to display the...
... from the Table Editor To edit a selected Y= function from the Y= Editor In the Y= editor, enter the functions that defines a dependent variable without having to view the function that define the ...are displayed in the Y= editor are calculated. Press } until the cursor is used. Edit the function. 4. Defining the Dependent Variables Defining Dependent Variables from the table editor, follow these steps. 1. Chapter 7: Tables 117 The current graphing mode is on the bottom line. 3. The table and the Y= function are updated automatically. Press y 0 to display the...

