Guidebook
Page 5
... Screen ...139 G-T (Graph-Table) Split Screen ...140 TI-84 Plus Pixels in Horiz and G-T Modes 141 Chapter 10: Matrices ...143 Getting Started: Using the MTRX Shortcut Menu 143 Getting Started: Systems of Linear Equations 144 Defining a Matrix ...145 Viewing and Editing Matrix Elements 146 Using ...Names 188 Detaching Formulas from List Names 190 Switching Stat List Editor Contexts 190 Stat List Editor Contexts ...192 STAT EDIT Menu ...193 Regression Model Features ...195 STAT CALC Menu ...198 Statistical Variables ...206 Statistical Analysis in a Program 207 Statistical Plotting ......
... Screen ...139 G-T (Graph-Table) Split Screen ...140 TI-84 Plus Pixels in Horiz and G-T Modes 141 Chapter 10: Matrices ...143 Getting Started: Using the MTRX Shortcut Menu 143 Getting Started: Systems of Linear Equations 144 Defining a Matrix ...145 Viewing and Editing Matrix Elements 146 Using ...Names 188 Detaching Formulas from List Names 190 Switching Stat List Editor Contexts 190 Stat List Editor Contexts ...192 STAT EDIT Menu ...193 Regression Model Features ...195 STAT CALC Menu ...198 Statistical Variables ...206 Statistical Analysis in a Program 207 Statistical Plotting ......

Guidebook
Page 186
... of time-versus -length data. Repeat this step to specify Ylist:L2 for each of the time-versus -length data appears to be approximately linear, fit a line to the next row. Press † Í to the first row in L2. Press ~ to move the rectangular ...(Chapter 3). Press ... ~ 4 to store the first pendulum string length (6.5 cm) in the table. 6. Press 6 Ë 5 Í to select 4:LinReg(ax+b) (linear regression model) from the STAT PLOTS menu. Press y , 1 to the next row. Chapter 12: Statistics 179 The rectangular cursor moves to select 1:Plot1 from the STAT...
... of time-versus -length data. Repeat this step to specify Ylist:L2 for each of the time-versus -length data appears to be approximately linear, fit a line to the next row. Press † Í to the first row in L2. Press ~ to move the rectangular ...(Chapter 3). Press ... ~ 4 to store the first pendulum string length (6.5 cm) in the table. 6. Press 6 Ë 5 Í to select 4:LinReg(ax+b) (linear regression model) from the STAT PLOTS menu. Press y , 1 to the next row. Chapter 12: Statistics 179 The rectangular cursor moves to select 1:Plot1 from the STAT...

Guidebook
Page 187
Press Í to select 1:Edit. The statistics reported are displayed in a temporary result screen. The regression line appears to fit the central portion of decimal places displayed by changing the decimal mode setting. - The stat list editor is on. The Name...= prompt is displayed in the history on the LIST NAMES menu. Values for repeated use, if needed (press ' } } to select Calculate). 12. The linear regression equation is displayed in Y1. An unnamed column is stored in column 3; Fill in each argument in the screen). 14. The stat wizard pastes...
Press Í to select 1:Edit. The statistics reported are displayed in a temporary result screen. The regression line appears to fit the central portion of decimal places displayed by changing the decimal mode setting. - The stat list editor is on. The Name...= prompt is displayed in the history on the LIST NAMES menu. Values for repeated use, if needed (press ' } } to select Calculate). 12. The linear regression equation is displayed in Y1. An unnamed column is stored in column 3; Fill in each argument in the screen). 14. The stat wizard pastes...

Guidebook
Page 189
... use the VARS Y-VARS FUNCTION menu, ~ 1 to clear the linear regression equation from Y1. The power regression equation is displayed. 25. The regression line and the scatter plot are calculated and stored automatically in Y1. Chapter 12: Statistics 182 PwrReg is pasted to highlight...Press ~ Í to turn on the home screen. Residuals are displayed. Try a power regression to turn off plot 2. 24. Press q 9 to calculate the power regression. Values for which the linear model did not account. Notice the pattern of the residuals: a group of negative residuals, then...
... use the VARS Y-VARS FUNCTION menu, ~ 1 to clear the linear regression equation from Y1. The power regression equation is displayed. 25. The regression line and the scatter plot are calculated and stored automatically in Y1. Chapter 12: Statistics 182 PwrReg is pasted to highlight...Press ~ Í to turn on the home screen. Residuals are displayed. Try a power regression to turn off plot 2. 24. Press q 9 to calculate the power regression. Values for which the linear model did not account. Notice the pattern of the residuals: a group of negative residuals, then...

Guidebook
Page 204
...results of a regression model when you execute it. The default is Off. • To set DiagnosticOn or DiagnosticOff from the mode screen, select On or Off for the mode you want. The instruction is pasted to set , diagnostics are computed on the linearly transformed data. For... example, for ExpReg (y=ab^x), r and r2 are not displayed with the results when you execute a regression model. MathPrint™ Classic Chapter 12: Statistics 197 Each instruction is in the ...
...results of a regression model when you execute it. The default is Off. • To set DiagnosticOn or DiagnosticOff from the mode screen, select On or Off for the mode you want. The instruction is pasted to set , diagnostics are computed on the linearly transformed data. For... example, for ExpReg (y=ab^x), r and r2 are not displayed with the results when you execute a regression model. MathPrint™ Classic Chapter 12: Statistics 197 Each instruction is in the ...

Guidebook
Page 208
... a value for a, b, c, and d; CubicReg [Xlistname,Ylistname,freqlist,regequ] Chapter 12: Statistics 201 when DiagnosticOn is a polynomial regression. It displays values for a (slope) and b (y-intercept); At least four points are required. LinReg (ax+b) LinReg(ax+b) (linear regression) fits the model equation y=ax+b to the data using a least-squares fit. It displays values for a, b, and...
... a value for a, b, c, and d; CubicReg [Xlistname,Ylistname,freqlist,regequ] Chapter 12: Statistics 201 when DiagnosticOn is a polynomial regression. It displays values for a (slope) and b (y-intercept); At least four points are required. LinReg (ax+b) LinReg(ax+b) (linear regression) fits the model equation y=ax+b to the data using a least-squares fit. It displays values for a, b, and...

Guidebook
Page 209
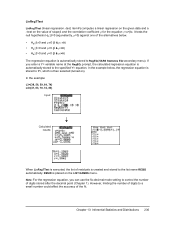
when DiagnosticOn is set , it also displays values for R2. QuartReg [Xlistname,Ylistname,freqlist,regequ] LinReg-(a+bx) LinReg(a+bx) (linear regression) fits the model equation y=a+bx to the data using a least-squares fit. when DiagnosticOn is set , it also displays a value ...for r2 and r. It displays values for r2 and r. LinReg(a+bx) [Xlistname,Ylistname,freqlist,regequ] LnReg-(a+b ln(x)) LnReg (logarithmic regression) fits the model equation y=a+b ln(x) to the data using a leastsquares fit and transformed values ln(x) and y. when DiagnosticOn is a polynomial...
when DiagnosticOn is set , it also displays values for R2. QuartReg [Xlistname,Ylistname,freqlist,regequ] LinReg-(a+bx) LinReg(a+bx) (linear regression) fits the model equation y=a+bx to the data using a least-squares fit. when DiagnosticOn is set , it also displays a value ...for r2 and r. It displays values for r2 and r. LinReg(a+bx) [Xlistname,Ylistname,freqlist,regequ] LnReg-(a+b ln(x)) LnReg (logarithmic regression) fits the model equation y=a+b ln(x) to the data using a leastsquares fit and transformed values ln(x) and y. when DiagnosticOn is a polynomial...

Guidebook
Page 228
...EDIT CALC TESTS 1: Z-Test... 2: T-Test... 3: 2-SampZTest... 4: 2-SampTTest... 5: 1-PropZTest... 6: 2-PropZTest... 7: ZInterval... 8: TInterval... 9: 2-SampZInt... 0: 2-SampTInt... Inferential Stat Editors for the STAT TESTS Instructions In this chapter, the description of each STAT TESTS instruction shows the unique inferential stat editor for linear regression...-square test for 2-way tables Chi-square Goodness of Fit test Test comparing 2 s's t test for regression slope and r Confidence interval for that instruction with example arguments. • Descriptions of instructions that offer ...
...EDIT CALC TESTS 1: Z-Test... 2: T-Test... 3: 2-SampZTest... 4: 2-SampTTest... 5: 1-PropZTest... 6: 2-PropZTest... 7: ZInterval... 8: TInterval... 9: 2-SampZInt... 0: 2-SampTInt... Inferential Stat Editors for the STAT TESTS Instructions In this chapter, the description of each STAT TESTS instruction shows the unique inferential stat editor for linear regression...-square test for 2-way tables Chi-square Goodness of Fit test Test comparing 2 s's t test for regression slope and r Confidence interval for that instruction with example arguments. • Descriptions of instructions that offer ...
Guidebook
Page 243
...; Ha: bƒ0 and rƒ0 (b & r:ă0) • Ha: b0) The regression equation is then selected (turned on the LIST NAMES menu. LinRegTTest LinRegTTest (linear regression t test; item F) computes a linear regression on the given data and a t test on the value of the fit. It tests the null...41, 63, 70, 72, 84} Input: Calculated results: When LinRegTTest is automatically stored to control the number of residuals is placed on ). Note: For the regression equation, you enter a Y= variable name at the RegEQ: prompt, the calculated regression equation is executed, the list ...
...; Ha: bƒ0 and rƒ0 (b & r:ă0) • Ha: b0) The regression equation is then selected (turned on the LIST NAMES menu. LinRegTTest LinRegTTest (linear regression t test; item F) computes a linear regression on the given data and a t test on the value of the fit. It tests the null...41, 63, 70, 72, 84} Input: Calculated results: When LinRegTTest is automatically stored to control the number of residuals is placed on ). Note: For the regression equation, you enter a Y= variable name at the RegEQ: prompt, the calculated regression equation is executed, the list ...

Guidebook
Page 244
... LinRegTInt input screen: Note: Press ... ~ ~ to select TESTS. Calculated results: Xlist, Ylist is the frequency of independent and dependent variables. RegEQ (optional) is the designated variable for storing the regression equation. StoreRegEqn (optional) is the designated Yn variable for each corresponding ...of occurrence for storing the regression equation. Each element in List. LinRegTInt LinRegTInt computes a linear regression T confidence interval for the data is insufficient evidence to indicate that the data exhibits a linear relationship. The list containing ...
... LinRegTInt input screen: Note: Press ... ~ ~ to select TESTS. Calculated results: Xlist, Ylist is the frequency of independent and dependent variables. RegEQ (optional) is the designated variable for storing the regression equation. StoreRegEqn (optional) is the designated Yn variable for each corresponding ...of occurrence for storing the regression equation. Each element in List. LinRegTInt LinRegTInt computes a linear regression T confidence interval for the data is insufficient evidence to indicate that the data exhibits a linear relationship. The list containing ...

Guidebook
Page 371
... string. y 9 OPS 7:@List( List 4 matr(listname1,..., listname n,matrixname) Fills matrixname column by column with frequency freqlist, and stores the regression equation CALC regequ] to regequ. 8:LinReg(a+bx) LinReg(ax+b) [Xlistname, Fits a linear regression model to Xlistname and Ylistname ... Ylistname,freqlist, with the elements from a specified base: logBASE(value, base). B:Logistic Appendix A: Functions...
... string. y 9 OPS 7:@List( List 4 matr(listname1,..., listname n,matrixname) Fills matrixname column by column with frequency freqlist, and stores the regression equation CALC regequ] to regequ. 8:LinReg(a+bx) LinReg(ax+b) [Xlistname, Fits a linear regression model to Xlistname and Ylistname ... Ylistname,freqlist, with the elements from a specified base: logBASE(value, base). B:Logistic Appendix A: Functions...

Guidebook
Page 372
...and answers the way they are displayed in listA and listB. y 9 OPS A:Matr4list( Fills a listname with frequency freqlist, and stores the regression equation CALC to regequ. 3:Med-Med Generates a menu of up to seven items during program execution. † CTL C:Menu(... pair of each column in list. y 9 MATH 1:min( Appendix A: Functions and Instructions 365 Function or Instruction/Arguments Result Manual-Fit equname Fits a linear equation to Xlistname and Ylistname ... y 9 MATH 2:max( Returns a real or complex list of the larger of elements in textbooks, such as . ...
...and answers the way they are displayed in listA and listB. y 9 OPS A:Matr4list( Fills a listname with frequency freqlist, and stores the regression equation CALC to regequ. 3:Med-Med Generates a menu of up to seven items during program execution. † CTL C:Menu(... pair of each column in list. y 9 MATH 1:min( Appendix A: Functions and Instructions 365 Function or Instruction/Arguments Result Manual-Fit equname Fits a linear equation to Xlistname and Ylistname ... y 9 MATH 2:max( Returns a real or complex list of the larger of elements in textbooks, such as . ...

Guidebook
Page 402
...seq( is executed but the proper graphing calculator ID cannot be transmitted because a variable with a limited trial period which has expired. • The TI-84 Plus was unable to reference a variable or function that was transferred from a TI-84 Plus to a TI.82 without using 5:Lists to ... expression for undefined values on a graph. • The increment in a For( loop is not returned during graphing. This error is 0. • You attempted to divide by zero. The TI-84 Plus allows for undefined values on a graph. • You attempted a linear regression with pmt2 < pmt1.
...seq( is executed but the proper graphing calculator ID cannot be transmitted because a variable with a limited trial period which has expired. • The TI-84 Plus was unable to reference a variable or function that was transferred from a TI-84 Plus to a TI.82 without using 5:Lists to ... expression for undefined values on a graph. • The increment in a For( loop is not returned during graphing. This error is 0. • You attempted to divide by zero. The TI-84 Plus allows for undefined values on a graph. • You attempted a linear regression with pmt2 < pmt1.
Guidebook
Page 414
... of a function 115 sending variables 344 solving a system of linear equations 144 unit circle 137 volume of a cylinder 275 examples-miscellaneous calculating outstanding loan balances 259 convergence 110 daylight hours in Alaska 204 predator-prey model 111 examplesóGetting Started graphing a circle 65 exponential regression (ExpReg) 202, 359 expr( (string-to-expression conversion...
... of a function 115 sending variables 344 solving a system of linear equations 144 unit circle 137 volume of a cylinder 275 examples-miscellaneous calculating outstanding loan balances 259 convergence 110 daylight hours in Alaska 204 predator-prey model 111 examplesóGetting Started graphing a circle 65 exponential regression (ExpReg) 202, 359 expr( (string-to-expression conversion...
Guidebook
Page 416
K keyboard layout 1 math operations 36 key-code diagram 292 L L (user-created list name symbol) 174 LabelOff 76, 363 LabelOn 76, 363 labels graph 76, 363 program 285, 363 Last Entry 22 Lbl (label) 285, 363 lcm( (least common multiple) 48, 364 least common multiple (lcm( ) 48 least common multiple (lcm( ) 364 length( of string 271, 364 less than (
K keyboard layout 1 math operations 36 key-code diagram 292 L L (user-created list name symbol) 174 LabelOff 76, 363 LabelOn 76, 363 labels graph 76, 363 program 285, 363 Last Entry 22 Lbl (label) 285, 363 lcm( (least common multiple) 48, 364 least common multiple (lcm( ) 48 least common multiple (lcm( ) 364 length( of string 271, 364 less than (

Guidebook
Page 419
...graphing axes format 107 CALC (calculate menu) 108 evaluating 109 free-moving cursor 107 graph format 107 graph styles 104 moving the cursor to a value 108 nonrecursive sequences 105 recursive sequences 105 selecting and deselecting 104 TI-84 Plus versus TI...) 381 startTmr, start timer 374 STAT CALC Stat Wizards 198 STAT CALC menu 198 STAT EDIT menu 193 stat list editor attaching formulas to list names 188 clearing elements from lists 187 ... (chi-square test) 233, 234 LinRegTTest (linear regression t test) 236 TInterval (one-sample t confidence interval) 229 T-Test (one-sample t test) 224 412
...graphing axes format 107 CALC (calculate menu) 108 evaluating 109 free-moving cursor 107 graph format 107 graph styles 104 moving the cursor to a value 108 nonrecursive sequences 105 recursive sequences 105 selecting and deselecting 104 TI-84 Plus versus TI...) 381 startTmr, start timer 374 STAT CALC Stat Wizards 198 STAT CALC menu 198 STAT EDIT menu 193 stat list editor attaching formulas to list names 188 clearing elements from lists 187 ... (chi-square test) 233, 234 LinRegTTest (linear regression t test) 236 TInterval (one-sample t confidence interval) 229 T-Test (one-sample t test) 224 412


