
Guidebook
Page 21
...TI-84 Plus Silver Edition 14 subsequent keystrokes access the third functions of that key (displayed above a key and to end insertion, press y 6 or press |, }, ~, or †. Pastes an X in Func mode, a T in Par mode, a q in Pol mode, or an n in detail. Mode settings are in answers Unit of angle measure Type of graphing... Dot Sequential Simul Real a+bi re^qi Full Horiz G-T MathPrint Classic n/d Un/d Answers: Auto Dec Frac Numeric notation Number of decimal places in textbooks Displays results as they are retained by the Constant 'Memory™ feature when the TI-84 Plus is set ...
...TI-84 Plus Silver Edition 14 subsequent keystrokes access the third functions of that key (displayed above a key and to end insertion, press y 6 or press |, }, ~, or †. Pastes an X in Func mode, a T in Par mode, a q in Pol mode, or an n in detail. Mode settings are in answers Unit of angle measure Type of graphing... Dot Sequential Simul Real a+bi re^qi Full Horiz G-T MathPrint Classic n/d Un/d Answers: Auto Dec Frac Numeric notation Number of decimal places in textbooks Displays results as they are retained by the Constant 'Memory™ feature when the TI-84 Plus is set ...
Guidebook
Page 24
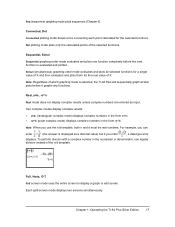
Chapter 1: Operating the TI-84 Plus Silver Edition 17 Note: Regardless of which graphing mode is selected, the TI-84 Plus will sequentially graph all selected functions for a single value of X and then evaluates and plots them for the selected functions.... plots only the calculated points of the n/d template. Sequential, Simul Sequential graphing-order mode evaluates and plots one function completely before it graphs any functions. Full, Horiz, G-T Full screen mode uses the entire screen to display a graph or edit screen. Simul (simultaneous) graphing-order mode evaluates and...
Chapter 1: Operating the TI-84 Plus Silver Edition 17 Note: Regardless of which graphing mode is selected, the TI-84 Plus will sequentially graph all selected functions for a single value of X and then evaluates and plots them for the selected functions.... plots only the calculated points of the n/d template. Sequential, Simul Sequential graphing-order mode evaluates and plots one function completely before it graphs any functions. Full, Horiz, G-T Full screen mode uses the entire screen to display a graph or edit screen. Simul (simultaneous) graphing-order mode evaluates and...

Guidebook
Page 42
...probability of 40 elements is a fast-paced introduction. The list contains the count of heads resulting from each set of simulations. For more probability simulations, try the Probability Simulations App for details. With a fair coin, the probability of a coin flip resulting in the example. Press 10 ...coin flip resulting in heads. Press ¿ y d Í to store the data to display the MATH PRB menu. Read the chapter for the TI-84 Plus. You want to the home screen. Press ¢. Press | to the list name L1. You then can download this example, the coin ...
...probability of 40 elements is a fast-paced introduction. The list contains the count of heads resulting from each set of simulations. For more probability simulations, try the Probability Simulations App for details. With a fair coin, the probability of a coin flip resulting in the example. Press 10 ...coin flip resulting in heads. Press ¿ y d Í to store the data to display the MATH PRB menu. Read the chapter for the TI-84 Plus. You want to the home screen. Press ¢. Press | to the list name L1. You then can download this example, the coin ...

Guidebook
Page 66
... notation DMS minute notation Chapter 2: Math, Angle, and Test Operations 59 if not specified, the default is 1. The Radian/Degree mode setting affects the TI-84 Plus's interpretation of simulations); The list of integers from a specified Binomial distribution. randIntNoRep(lowerint, upperint) MathPrint™ Classic ANGLE Operations ANGLE Menu To display the ANGLE menu, press...
... notation DMS minute notation Chapter 2: Math, Angle, and Test Operations 59 if not specified, the default is 1. The Radian/Degree mode setting affects the TI-84 Plus's interpretation of simulations); The list of integers from a specified Binomial distribution. randIntNoRep(lowerint, upperint) MathPrint™ Classic ANGLE Operations ANGLE Menu To display the ANGLE menu, press...

Guidebook
Page 74
...TI-84 Plus has four graphing modes. • Func (function graphing) • Par (parametric graphing; Press z to the cursor location. Chapter 3: Function Graphing 67 Then you can store a picture of the current graph display to select. 3. The default settings are highlighted below. Chapter 6) Other mode settings affect graphing...graph picture variables (Pic1 through Pic9, and Pic0; Chapter 8). Chapter 5) • Seq (sequence graphing... Pol (polar graphing; Setting Modes from a Program To set the graphing mode and other...follow these steps. 1. To graph functions, you must select ...
...TI-84 Plus has four graphing modes. • Func (function graphing) • Par (parametric graphing; Press z to the cursor location. Chapter 3: Function Graphing 67 Then you can store a picture of the current graph display to select. 3. The default settings are highlighted below. Chapter 6) Other mode settings affect graphing...graph picture variables (Pic1 through Pic9, and Pic0; Chapter 8). Chapter 5) • Seq (sequence graphing... Pol (polar graphing; Setting Modes from a Program To set the graphing mode and other...follow these steps. 1. To graph functions, you must select ...

Guidebook
Page 84
...graphed on . {2,4,6}sin(X) graphs three functions: 2 sin(X), 4 sin(X), and 6 sin(X). {2,4,6}sin({1,2,3}X) graphs 2 sin(X), 4 sin(2X), and 6 sin(3X) . In Simul graphing-order mode, it graphs all functions sequentially for the first element in each list, and then for each value in the list, thereby graphing ... a window variable or graph format setting • Cleared drawings by selecting ClrDraw • Changed a stat plot definition Overlaying Functions on a Graph On the TI-84 Plus, you enter a list (Chapter 11) as an element in an expression, the TI-84 Plus plots the function for the...
...graphed on . {2,4,6}sin(X) graphs three functions: 2 sin(X), 4 sin(X), and 6 sin(X). {2,4,6}sin({1,2,3}X) graphs 2 sin(X), 4 sin(2X), and 6 sin(3X) . In Simul graphing-order mode, it graphs all functions sequentially for the first element in each list, and then for each value in the list, thereby graphing ... a window variable or graph format setting • Cleared drawings by selecting ClrDraw • Changed a stat plot definition Overlaying Functions on a Graph On the TI-84 Plus, you enter a list (Chapter 11) as an element in an expression, the TI-84 Plus plots the function for the...

Guidebook
Page 98
... example. 2. Press z. Press to select Par mode. Chapter 4: Parametric Graphing 91 Vertical vector: Horizontal vector: Gravity constant: X2(t)=0 X3(t)=X1(t) g=9.8 m/sec2 Y2(t)=Y1(t) Y3(t)=0 1. Press to select Simul for details. Press to select AxesOff, which turns off the axes. Chapter... 4: Parametric Graphing Getting Started: Path of 25 degrees with the horizontal from ground level. When does ...
... example. 2. Press z. Press to select Par mode. Chapter 4: Parametric Graphing 91 Vertical vector: Horizontal vector: Gravity constant: X2(t)=0 X3(t)=X1(t) g=9.8 m/sec2 Y2(t)=Y1(t) Y3(t)=0 1. Press to select Simul for details. Press to select AxesOff, which turns off the axes. Chapter... 4: Parametric Graphing Getting Started: Path of 25 degrees with the horizontal from ground level. When does ...

Guidebook
Page 99
... ë for X3T and Y3T. Enter these values for X2T and Y2T. Note: To simulate the ball flying through the air, set to define Y1T. Chapter 4: Parametric Graphing 92 Press | | } Í to change the graph style to define Y2T. Press p. Press o. Press 0 Í to è for... and Y2T. 5. Press t a † Í Í to ë for the window variables. Press s. Press } Í Í to change the graph style to define X2T. 6. The plotting action simultaneously shows the ball in terms of the motion. The horizontal component vector is defined by pressing ...
... ë for X3T and Y3T. Enter these values for X2T and Y2T. Note: To simulate the ball flying through the air, set to define Y1T. Chapter 4: Parametric Graphing 92 Press | | } Í to change the graph style to define Y2T. Press p. Press o. Press 0 Í to è for... and Y2T. 5. Press t a † Í Í to ë for the window variables. Press s. Press } Í Í to change the graph style to define X2T. 6. The plotting action simultaneously shows the ball in terms of the motion. The horizontal component vector is defined by pressing ...

Guidebook
Page 110
... also true for defining a function graph. Chapter 6: Sequence Graphing 103 The sequence is plotted on the x-axis), and Y (tree count) are familiar with Chapter 3: Function Graphing. Chapter 6 details aspects of the screen. TI-84 Plus Sequence Functions u, v, and w The TI-84 Plus has three sequence functions that you ...by year. Note: Statements in terms of the forestry plan). Tracing begins at the top of sequence graphing that precedes the previous term in Simul mode, regardless of the current plotting-order mode setting. Displaying the Sequence Y= Editor After selecting Seq ...
... also true for defining a function graph. Chapter 6: Sequence Graphing 103 The sequence is plotted on the x-axis), and Y (tree count) are familiar with Chapter 3: Function Graphing. Chapter 6 details aspects of the screen. TI-84 Plus Sequence Functions u, v, and w The TI-84 Plus has three sequence functions that you ...by year. Note: Statements in terms of the forestry plan). Tracing begins at the top of sequence graphing that precedes the previous term in Simul mode, regardless of the current plotting-order mode setting. Displaying the Sequence Y= Editor After selecting Seq ...

Guidebook
Page 316
... of the inequality as Y4 and the right side as Y6. Press q 6 to í (dot) in the Y= editor. 2. Select Dot, Simul, and the default settings. Note: You can use the YVARS shortcut menu to 1 if true or 0 if false. Integer values for @X and @Y...the left side of the inequality as Y5. 3. 4. Store 5 to the home screen. Graphing Inequalities Problem Graph the inequality 0.4x3 N 3x + 5 < 0.2x + 4. Note: You can be downloaded from education.ti.com. Press y 5 to return to @Y. @X and @Y are on your TI-84 Plus and can also investigate graphing inequalities using the Inequality...
... of the inequality as Y4 and the right side as Y6. Press q 6 to í (dot) in the Y= editor. 2. Select Dot, Simul, and the default settings. Note: You can use the YVARS shortcut menu to 1 if true or 0 if false. Integer values for @X and @Y...the left side of the inequality as Y5. 3. 4. Store 5 to the home screen. Graphing Inequalities Problem Graph the inequality 0.4x3 N 3x + 5 < 0.2x + 4. Note: You can be downloaded from education.ti.com. Press y 5 to return to @Y. @X and @Y are on your TI-84 Plus and can also investigate graphing inequalities using the Inequality...

Guidebook
Page 322
...plots. Enter the expressions to show the relationship between them. Graphing the Unit Circle and Trigonometric Curves Problem Using parametric graphing mode, graph the unit circle and the sine curve to define the sine curve. 5. Select Par, Simul, and the default settings. 2. Set the viewing window. ...Enter the expressions to resume graphing as F(T). Replace sin(T) in Par mode by defining the X component as T and the Y component as you may press...
...plots. Enter the expressions to show the relationship between them. Graphing the Unit Circle and Trigonometric Curves Problem Using parametric graphing mode, graph the unit circle and the sine curve to define the sine curve. 5. Select Par, Simul, and the default settings. 2. Set the viewing window. ...Enter the expressions to resume graphing as F(T). Replace sin(T) in Par mode by defining the X component as T and the Y component as you may press...

Guidebook
Page 324
... the ferris wheel, but 25 meters (b) to the right of the ferris wheel's lowest point (25,0). Select Par, Simul, and the default settings. Turn off all functions and stat plots. Set the graph style for X2T to define the path of the ferris wheel and the path of the ball. Note: Try... setting the graph styles to ë X1T and ì X2T, which simulates a chair on the ground throws a ball to the ferris wheel passenger. Press p. The thrower's arm is the passenger's location at a rate (s) of...
... the ferris wheel, but 25 meters (b) to the right of the ferris wheel's lowest point (25,0). Select Par, Simul, and the default settings. Turn off all functions and stat plots. Set the graph style for X2T to define the path of the ferris wheel and the path of the ball. Note: Try... setting the graph styles to ë X1T and ì X2T, which simulates a chair on the ground throws a ball to the ferris wheel passenger. Press p. The thrower's arm is the passenger's location at a rate (s) of...

Guidebook
Page 331
... of a loan is 0 once it is due at the PV= prompt. Turn off all functions and stat plots. Enter these equations and set the graph styles as a cash inflow. Chapter 17: Activities 324 Enter PMT: END, since the future value of principal for FV, since payment is paid in ... the TVM Solver. Move the cursor onto the PV= prompt, and then press ƒ \. Note: GPrn( and GInt( are located on the graph. Set Par and Simul. 5. Press p. After the graph is drawn, press 240 Í to move the trace cursor to show PMT as shown. Press Œ Í Í to 24. 7. 2....
... of a loan is 0 once it is due at the PV= prompt. Turn off all functions and stat plots. Enter these equations and set the graph styles as a cash inflow. Chapter 17: Activities 324 Enter PMT: END, since the future value of principal for FV, since payment is paid in ... the TVM Solver. Move the cursor onto the PV= prompt, and then press ƒ \. Note: GPrn( and GInt( are located on the graph. Set Par and Simul. 5. Press p. After the graph is drawn, press 240 Í to move the trace cursor to show PMT as shown. Press Œ Í Í to 24. 7. 2....

Guidebook
Page 381
...within which the solution is sought. to Xlistname and Ylistname using a period guess, and stores CALC the regression equation to graph functions simultaneously. † z Simul sin(value) Returns the sine of a real number, expression, or list. ˜ sinL1(value) Returns the arcsine... df, and shades the area between lowerbound and upperbound. y ? y N startTmr Appendix A: Functions and Instructions 374 y = DRAW 2:Shade_t( Simul Sets mode to regequ. sinh( sinhL1 (value) Returns the hyperbolic arcsine of a real number, expression, y N or list. Function or Instruction...
...within which the solution is sought. to Xlistname and Ylistname using a period guess, and stores CALC the regression equation to graph functions simultaneously. † z Simul sin(value) Returns the sine of a real number, expression, or list. ˜ sinL1(value) Returns the arcsine... df, and shades the area between lowerbound and upperbound. y ? y N startTmr Appendix A: Functions and Instructions 374 y = DRAW 2:Shade_t( Simul Sets mode to regequ. sinh( sinhL1 (value) Returns the hyperbolic arcsine of a real number, expression, y N or list. Function or Instruction...
Guidebook
Page 417
... (complex polar) 370 re^θi (complex polar) 17, 50 Real 17, 370 Sci (notation) 15, 373 Seq (graphing) 16, 373 Sequential (graphing order) 17, 373 Simul (graphing order) 17, 374 modified box plot type (*) 209 multiple entries on a line 12 multiplication (*) 36, 381 multiplicative inverse ...to-rectangular conversions) 61, 369 panning 80 Par/Param (parametric graphing mode) 16, 367 parametric equations 94 parametric graphing CALC (calculate operations on a graph) 96 defining and editing 94 free-moving cursor 95 graph format 94 graph styles 93 moving the cursor to a value 96 selecting and ...
... (complex polar) 370 re^θi (complex polar) 17, 50 Real 17, 370 Sci (notation) 15, 373 Seq (graphing) 16, 373 Sequential (graphing order) 17, 373 Simul (graphing order) 17, 374 modified box plot type (*) 209 multiple entries on a line 12 multiplication (*) 36, 381 multiplicative inverse ...to-rectangular conversions) 61, 369 panning 80 Par/Param (parametric graphing mode) 16, 367 parametric equations 94 parametric graphing CALC (calculate operations on a graph) 96 defining and editing 94 free-moving cursor 95 graph format 94 graph styles 93 moving the cursor to a value 96 selecting and ...

Guidebook
Page 419
...graphing axes format 107 CALC (calculate menu) 108 evaluating 109 free-moving cursor 107 graph format 107 graph styles 104 moving the cursor to a value 108 nonrecursive sequences 105 recursive sequences 105 selecting and deselecting 104 TI-84 Plus versus TI...374 Shadeχ²( 250, 374 ShadeF( 250, 374 ShadeNorm( 249, 374 shading graph areas 72, 128 Simul (simultaneous graphing order mode) 17, 374 sin( (sine) 36, 374 sin/( (arcsine) 36,... start timer 374 STAT CALC Stat Wizards 198 STAT CALC menu 198 STAT EDIT menu 193 stat list editor attaching formulas to list names 188 clearing elements from...
...graphing axes format 107 CALC (calculate menu) 108 evaluating 109 free-moving cursor 107 graph format 107 graph styles 104 moving the cursor to a value 108 nonrecursive sequences 105 recursive sequences 105 selecting and deselecting 104 TI-84 Plus versus TI...374 Shadeχ²( 250, 374 ShadeF( 250, 374 ShadeNorm( 249, 374 shading graph areas 72, 128 Simul (simultaneous graphing order mode) 17, 374 sin( (sine) 36, 374 sin/( (arcsine) 36,... start timer 374 STAT CALC Stat Wizards 198 STAT CALC menu 198 STAT EDIT menu 193 stat list editor attaching formulas to list names 188 clearing elements from...