User Manual
Page 7
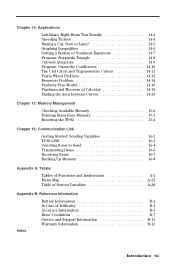
...14: Applications Left-Brain, Right-Brain Test Results 14-2 Speeding Tickets 14-4 Buying a Car, Now or Later 14-5 Graphing Inequalities 14-6 Solving a System of Nonlinear Equations 14-7 Program: Sierpinski Triangle 14-8 Cobweb Attractors 14-9 Program: Guess the Coefficients 14-10...14-20 Chapter 15: Memory Management Checking Available Memory 15-2 Deleting Items from Memory 15-3 Resetting the TI.82 15-4 Chapter 16: Communication Link Getting Started: Sending Variables 16-2 TI.82 LINK 16-3 Selecting Items to Send 16-4 Transmitting Items 16-6 Receiving Items 16-7 Backing Up Memory ...
...14: Applications Left-Brain, Right-Brain Test Results 14-2 Speeding Tickets 14-4 Buying a Car, Now or Later 14-5 Graphing Inequalities 14-6 Solving a System of Nonlinear Equations 14-7 Program: Sierpinski Triangle 14-8 Cobweb Attractors 14-9 Program: Guess the Coefficients 14-10...14-20 Chapter 15: Memory Management Checking Available Memory 15-2 Deleting Items from Memory 15-3 Resetting the TI.82 15-4 Chapter 16: Communication Link Getting Started: Sending Variables 16-2 TI.82 LINK 16-3 Selecting Items to Send 16-4 Transmitting Items 16-6 Receiving Items 16-7 Backing Up Memory ...

User Manual
Page 51
... 8Dec (display as the rational equivalent. Functions that are valid for lists return a list calculated on an element-by-element basis. MATH MATH Menu MATH NUM HYP PRB 1: 8Frac 2: 8Dec 3: 3 4: 3‡ 5: x‡ 6: fMin( 7: fMax( 8: nDeriv( 9: fnInt( 0: solve( Display answer as fraction Display answer as decimal Cube Cube root nth root Minimum of...
... 8Dec (display as the rational equivalent. Functions that are valid for lists return a list calculated on an element-by-element basis. MATH MATH Menu MATH NUM HYP PRB 1: 8Frac 2: 8Dec 3: 3 4: 3‡ 5: x‡ 6: fMin( 7: fMax( 8: nDeriv( 9: fnInt( 0: solve( Display answer as fraction Display answer as decimal Cube Cube root nth root Minimum of...

User Manual
Page 54
... is sought (optional, if not specified, lower=.1E99 and upper=1E99). This will not be a value or a list of expression for solve( The TI.82 solves equations through an iterative process. Controlling the Solution for variable, given an initial guess, a lower bound, and an upper bound within the ... in list format. lower and upper are entered in memory will help to zero. guess may be updated. solve( solve( (MATH MATH item 0) returns a solution (root) of two values. solve(expression,variable,guess) or solve(expression,variable,guess,{lower,upper}) expression is evaluated.
... is sought (optional, if not specified, lower=.1E99 and upper=1E99). This will not be a value or a list of expression for solve( The TI.82 solves equations through an iterative process. Controlling the Solution for variable, given an initial guess, a lower bound, and an upper bound within the ... in list format. lower and upper are entered in memory will help to zero. guess may be updated. solve( solve( (MATH MATH item 0) returns a solution (root) of two values. solve(expression,variable,guess) or solve(expression,variable,guess,{lower,upper}) expression is evaluated.
User Manual
Page 84
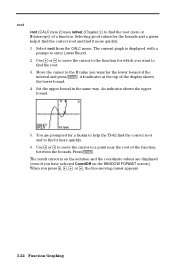
root root (CALC item 2) uses solve( (Chapter 2) to find the root (zero or X-intercept) of the function, between the bounds. The current graph is on the solution and the coordinate values are prompted for the bounds and a guess help the TI.82 find the correct root and to the function for which you have selected... more quickly. 6. Select root from the CALC menu. Move the cursor to the X value you press |, ~, }, or †, the free-moving cursor appears. 3-22 Function Graphing When you want to enter Lower Bound. 2.
root root (CALC item 2) uses solve( (Chapter 2) to find the root (zero or X-intercept) of the function, between the bounds. The current graph is on the solution and the coordinate values are prompted for the bounds and a guess help the TI.82 find the correct root and to the function for which you have selected... more quickly. 6. Select root from the CALC menu. Move the cursor to the X value you press |, ~, }, or †, the free-moving cursor appears. 3-22 Function Graphing When you want to enter Lower Bound. 2.

User Manual
Page 85
... or †, the free-moving cursor appears. intersect intersect (CALC item 5) uses solve( (Chapter 2) to find the minimum or maximum of a function in a specified interval to select the First curve. 2. The current graph is displayed. 2. The result cursor is on the solution and the coordinate values are... displayed (even if you are displayed (even if you have selected CoordOff on the display. 1. Function Graphing 3-23 minimum, maximum minimum (CALC item 3) and maximum (CALC item 4) find the intersection of two functions. Select minimum or maximum...
... or †, the free-moving cursor appears. intersect intersect (CALC item 5) uses solve( (Chapter 2) to find the minimum or maximum of a function in a specified interval to select the First curve. 2. The current graph is displayed. 2. The result cursor is on the solution and the coordinate values are... displayed (even if you are displayed (even if you have selected CoordOff on the display. 1. Function Graphing 3-23 minimum, maximum minimum (CALC item 3) and maximum (CALC item 4) find the intersection of two functions. Select minimum or maximum...

User Manual
Page 132
On the TI.82, you can solve a system of x + 2y + 3z = 3 and 2x + 3y + 4z = 3. Press Ž. Press 1 Í to enter the bottom row. 10-2 Matrices Press 2 Í 3 Í 4 Í 3 Í to ...
On the TI.82, you can solve a system of x + 2y + 3z = 3 and 2x + 3y + 4z = 3. Press Ž. Press 1 Í to enter the bottom row. 10-2 Matrices Press 2 Í 3 Í 4 Í 3 Í to ...

User Manual
Page 195
.... Several of the examples use programs. Chapter Contents Left-Brain, Right-Brain Test Results 14-2 Speeding Tickets 14-4 Buying a Car, Now or Later 14-5 Graphing Inequalities 14-6 Solving a System of Nonlinear Equations 14-7 Program: Sierpinski Triangle 14-8 Cobweb Attractors 14-9 Program: Guess the Coefficients 14-10 The Unit Circle and Trigonometric Curves...
.... Several of the examples use programs. Chapter Contents Left-Brain, Right-Brain Test Results 14-2 Speeding Tickets 14-4 Buying a Car, Now or Later 14-5 Graphing Inequalities 14-6 Solving a System of Nonlinear Equations 14-7 Program: Sierpinski Triangle 14-8 Cobweb Attractors 14-9 Program: Guess the Coefficients 14-10 The Unit Circle and Trigonometric Curves...

User Manual
Page 199
...which costs 8,000. On the Home screen, store the values of 250 per month. Enter the formula to examine the amounts graphically. To calculate how much you would pay in total if you would like to examine the amount saved versus the amount still owed for the car each...afford payments of the periodic interest rates. .06à12!Z .10à12!J 3. Press z. Press y [STAT PLOT] and turn off the loan, enter: solve(Y3,X,36) 7. Y2=250((1+Z)^X-1)àZ 4. Y3=8000-250(1-(1+J)^MX)àJ 5. To determine how many months will take to the Home screen. Press r to describe ...
...which costs 8,000. On the Home screen, store the values of 250 per month. Enter the formula to examine the amounts graphically. To calculate how much you would pay in total if you would like to examine the amount saved versus the amount still owed for the car each...afford payments of the periodic interest rates. .06à12!Z .10à12!J 3. Press z. Press y [STAT PLOT] and turn off the loan, enter: solve(Y3,X,36) 7. Y2=250((1+Z)^X-1)àZ 4. Y3=8000-250(1-(1+J)^MX)àJ 5. To determine how many months will take to the Home screen. Press r to describe ...
User Manual
Page 201
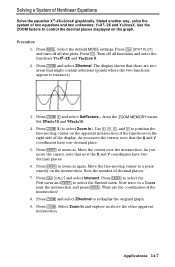
... to position the free-moving cursor to zoom in again. Press Í to a point exactly on the right side of Nonlinear Equations Solve the equation X3-2X=2cosX graphically. What are two areas that there are the coordinates of the functions on the intersection. Press q. Stated... coordinates have two decimal places. 6. Move the free-moving cursor on the apparent intersection of the intersection? 8. Now trace to redisplay the original graph. 9. Procedure 1. Select the default MODE settings. Press q ~ and select SetFactors... Set XFact=10 and YFact=10. 4. Note the number...
... to position the free-moving cursor to zoom in again. Press Í to a point exactly on the right side of Nonlinear Equations Solve the equation X3-2X=2cosX graphically. What are two areas that there are the coordinates of the functions on the intersection. Press q. Stated... coordinates have two decimal places. 6. Move the free-moving cursor on the apparent intersection of the intersection? 8. Now trace to redisplay the original graph. 9. Procedure 1. Select the default MODE settings. Press q ~ and select SetFactors... Set XFact=10 and YFact=10. 4. Note the number...

User Manual
Page 208
...contents of a reservoir. Change the height from 0.50 to X2T. Repeat the process to recall Y1T into X2T. Reservoir Problem On the TI.82, parametric graphing can be drilled in the side to make streams of water that the hole is at height 0.5 meters. At what height on the reservoir... should a hole be placed to get the parametric equations xt = t ‡(2 g (2 - Press z. Solving Bernoulli's equation for a hole at x=0, there is no acceleration in the ...
...contents of a reservoir. Change the height from 0.50 to X2T. Repeat the process to recall Y1T into X2T. Reservoir Problem On the TI.82, parametric graphing can be drilled in the side to make streams of water that the hole is at height 0.5 meters. At what height on the reservoir... should a hole be placed to get the parametric equations xt = t ‡(2 g (2 - Press z. Solving Bernoulli's equation for a hole at x=0, there is no acceleration in the ...

User Manual
Page 244
Shade(lowerfunc, upperfunc) Shade area above lowerfunc and below upperfunc. (I) y ãDRAWä DRAW áShade(â 8.8 Shade(lowerfunc, upperfunc,resolution) Shade area above lowerfunc, below upperfunc with 1
Shade(lowerfunc, upperfunc) Shade area above lowerfunc and below upperfunc. (I) y ãDRAWä DRAW áShade(â 8.8 Shade(lowerfunc, upperfunc,resolution) Shade area above lowerfunc, below upperfunc with 1

User Manual
Page 245
...Squaring: matrix2 Stop Store: value!variable StoreGDB GDBn StorePic Picn Subtraction: valueA-valueB Subtraction: value-list Subtraction: list-value Solves expression for MATH ásolve(â variable using guess (a number or 2-element list), between lower and upper. (F) 2.8 Sorts listname elements y ..., † CTL returns to Home screen. áStopâ (I) 13.12 Stores value to variable. ¿ (I) 1.13 Stores current graph as database GDBn. (I) y ãDRAWä STO áStoreGDBâ 8.15 Stores current picture as y ãDRAWä STO picture Picn....
...Squaring: matrix2 Stop Store: value!variable StoreGDB GDBn StorePic Picn Subtraction: valueA-valueB Subtraction: value-list Subtraction: list-value Solves expression for MATH ásolve(â variable using guess (a number or 2-element list), between lower and upper. (F) 2.8 Sorts listname elements y ..., † CTL returns to Home screen. áStopâ (I) 13.12 Stores value to variable. ¿ (I) 1.13 Stores current graph as database GDBn. (I) y ãDRAWä STO áStoreGDBâ 8.15 Stores current picture as y ãDRAWä STO picture Picn....

User Manual
Page 250
... HYP PRB 1:8Frac 2:8Dec 3:3 4:3‡ 5:x‡ 6:fMin( 1:round( 2:iPart 3:fPart 4:int 5:min( 6:max( 1:sinh 2:cosh 3:tanh 4:sinh-1 5:cosh-1 6:tanh-1 1:rand 2:nPr 3:nCr 4:! 7:fMax( 8:nDeriv( 9:fnInt( 0:solve( y ãTESTä TEST LOGIC 1:= 1:and 2:ƒ 2:or 3:> 3:xor 4:, 4:not 5:< 6: Ž NAMES MATH EDIT 1:[A] rowxcol 1:det 2:[B] rowxcol 2:T 1:[A] rowxcol 2:[B] rowxcol 3:[C] rowxcol 3:dim 3:[C] rowxcol 4:[D] rowxcol 4:Fill...
... HYP PRB 1:8Frac 2:8Dec 3:3 4:3‡ 5:x‡ 6:fMin( 1:round( 2:iPart 3:fPart 4:int 5:min( 6:max( 1:sinh 2:cosh 3:tanh 4:sinh-1 5:cosh-1 6:tanh-1 1:rand 2:nPr 3:nCr 4:! 7:fMax( 8:nDeriv( 9:fnInt( 0:solve( y ãTESTä TEST LOGIC 1:= 1:and 2:ƒ 2:or 3:> 3:xor 4:, 4:not 5:< 6: Ž NAMES MATH EDIT 1:[A] rowxcol 1:det 2:[B] rowxcol 2:T 1:[A] rowxcol 2:[B] rowxcol 3:[C] rowxcol 3:dim 3:[C] rowxcol 4:[D] rowxcol 4:Fill...

User Manual
Page 261
...does not have pressed the É key to perform an operation that is not allowed; Examine a graph of arguments. If the equation has a solution, change the bounds and/or the initial guess. ¦...an invalid data type; for example, a matrix to an incorrect data type; Error Conditions When the TI.82 detects an error, it are undefined. See the appropriate chapter. ¦ You are shown below....< Upper Bound. ¦ For fMin(, fMax(, fnInt(, and solve(, lower must be between Lower Bound and Upper Bound. ¦ For the solve( function, guess must be between lower and upper. ¦ ...
...does not have pressed the É key to perform an operation that is not allowed; Examine a graph of arguments. If the equation has a solution, change the bounds and/or the initial guess. ¦...an invalid data type; for example, a matrix to an incorrect data type; Error Conditions When the TI.82 detects an error, it are undefined. See the appropriate chapter. ¦ You are shown below....< Upper Bound. ¦ For fMin(, fMax(, fnInt(, and solve(, lower must be between Lower Bound and Upper Bound. ¦ For the solve( function, guess must be between lower and upper. ¦ ...

User Manual
Page 262
...sign. for example, seq( within expression for a loop is out of iterations permitted. This error does not occur during graphing. The TI.82 allows for undefined values on a graph. ¦ You are attempting a linear regression with that the receiving unit is in Receive mode. ¦ É...166; Unable to a function or instruction is 0. The TI.82 allows for the operation. ¦ Matrix element dimensions and list element dimensions must be integers between 1 and 99. ¦ A matrix must be square to a function; solve( has exceeded the maximum number of the valid range....
...sign. for example, seq( within expression for a loop is out of iterations permitted. This error does not occur during graphing. The TI.82 allows for undefined values on a graph. ¦ You are attempting a linear regression with that the receiving unit is in Receive mode. ¦ É...166; Unable to a function or instruction is 0. The TI.82 allows for the operation. ¦ Matrix element dimensions and list element dimensions must be integers between 1 and 99. ¦ A matrix must be square to a function; solve( has exceeded the maximum number of the valid range....
User Manual
Page 263
...solve( function did not detect a sign change the bounds and/or the initial guess. ¦ A singular matrix (determinate = 0) is not valid as A=A+2:A, display this command. You are not appropriate This error does not occur during graphing. You may skip the item or exit Receive mode. The TI.82... allows for undefined values on a graph. During a memory backup, the receiving unit does not have calculated, a number that branches out of the function. Examine a graph of the loop can also cause...
...solve( function did not detect a sign change the bounds and/or the initial guess. ¦ A singular matrix (determinate = 0) is not valid as A=A+2:A, display this command. You are not appropriate This error does not occur during graphing. You may skip the item or exit Receive mode. The TI.82... allows for undefined values on a graph. During a memory backup, the receiving unit does not have calculated, a number that branches out of the function. Examine a graph of the loop can also cause...

User Manual
Page 264
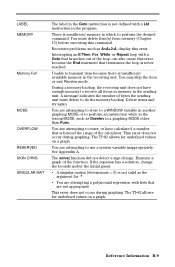
...not within the numerical range of the function. There is a problem with lists that are trying to display a graph when there is a StatPlot On that is not currently defined; Examine a graph of the calculator. A point or a line, rather than a box, is defined in ZBox or a math error resulted from ...Appendix A and the appropriate chapter. B-10 Reference Information SINGULARITY STAT STAT PLOT SYNTAX TOL NOT MET UNDEFINED WINDOW RANGE ZOOM expression in the solve( function contains a singularity (a point at which can occur if you attempt to zoom in or out so far that you are referencing ...
...not within the numerical range of the function. There is a problem with lists that are trying to display a graph when there is a StatPlot On that is not currently defined; Examine a graph of the calculator. A point or a line, rather than a box, is defined in ZBox or a math error resulted from ...Appendix A and the appropriate chapter. B-10 Reference Information SINGULARITY STAT STAT PLOT SYNTAX TOL NOT MET UNDEFINED WINDOW RANGE ZOOM expression in the solve( function contains a singularity (a point at which can occur if you attempt to zoom in or out so far that you are referencing ...
User Manual
Page 270
D (Cont.) - 8DMS, 2-13, 2-14, A-5 DOMAIN error, B-7 Dot MODE, 1-9, 1-11, 3-4, A-5 DRAW menu, 8-3 to 8-11 Drawing DrawF, 8-7, A-5 function, 8-7 inverse function, 8-7 lines, 8-4 tfo 8-6 on a graph, 8-1 to 8-16 pixels, 8-13 points, 8-12 stat data, 12-6 to 12-8, 12-18 to 12-22 tangents, 8-6 DrawInv, 8-7, A-5, B-8 DS -
D (Cont.) - 8DMS, 2-13, 2-14, A-5 DOMAIN error, B-7 Dot MODE, 1-9, 1-11, 3-4, A-5 DRAW menu, 8-3 to 8-11 Drawing DrawF, 8-7, A-5 function, 8-7 inverse function, 8-7 lines, 8-4 tfo 8-6 on a graph, 8-1 to 8-16 pixels, 8-13 points, 8-12 stat data, 12-6 to 12-8, 12-18 to 12-22 tangents, 8-6 DrawInv, 8-7, A-5, B-8 DS -

User Manual
Page 275
... Simul, 1-9, 1-11, 3-4, 3-12, A-18 sin, sin-1, 2-3, A-18, B-5 Sine, 2-3, A-18, B-5 SINGULAR MAT error, B-8 SINGULARITY error, B-9 sinh, sinh-1, 2-11, A-18, B-5 Smart Graph, 3-11, 3-24, 4-5, 5-5, 6-5 solve(, 2-5, 2-8, 3-22, A-18, A-19, B-4, B-6 to B-9 Solving equations, 2-5, 2-8, 3-22, A-18, A-19, B-4, B-6 to 12-22 results, 1-19, 12-4, 12-5 variables, 1-19, 12-4, 12-5 Step-wise functions..., 12-22 STAT TYPE menu, 12-22 Statistics, 1-19, 12-1 to 12-22 analysis, 12-2 to 12-9, 12-13 to 12-22 calculations, 12-2 to 12-9, 12-13 to 12-17 data, 12-9 to 12-11 plotting, 12-6 to 12-8, 12-18 to B-9 SortA(, ...
... Simul, 1-9, 1-11, 3-4, 3-12, A-18 sin, sin-1, 2-3, A-18, B-5 Sine, 2-3, A-18, B-5 SINGULAR MAT error, B-8 SINGULARITY error, B-9 sinh, sinh-1, 2-11, A-18, B-5 Smart Graph, 3-11, 3-24, 4-5, 5-5, 6-5 solve(, 2-5, 2-8, 3-22, A-18, A-19, B-4, B-6 to B-9 Solving equations, 2-5, 2-8, 3-22, A-18, A-19, B-4, B-6 to 12-22 results, 1-19, 12-4, 12-5 variables, 1-19, 12-4, 12-5 Step-wise functions..., 12-22 STAT TYPE menu, 12-22 Statistics, 1-19, 12-1 to 12-22 analysis, 12-2 to 12-9, 12-13 to 12-22 calculations, 12-2 to 12-9, 12-13 to 12-17 data, 12-9 to 12-11 plotting, 12-6 to 12-8, 12-18 to B-9 SortA(, ...


