User Manual
Page 34
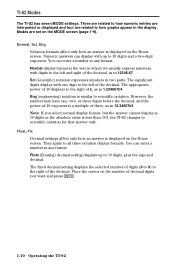
... 10 digits and a two-digit exponent. Float (floating) decimal setting displays up to 10 digits, plus the sign and decimal. Modes are related to the right of 10 displays to how graphs appear in any format. You can enter a number in 12.34667E3. Sci (scientific) notation expresses...three notation display formats. Eng (engineering) notation is less than .001, the TI.82 changes to the left of decimal digits you select normal display format, but the answer cannot display in 12346.67. TI-82 Modes The TI.82 has seven MODE settings. Note: If you want and press Í. 1-10...
... 10 digits and a two-digit exponent. Float (floating) decimal setting displays up to 10 digits, plus the sign and decimal. Modes are related to the right of 10 displays to how graphs appear in any format. You can enter a number in 12.34667E3. Sci (scientific) notation expresses...three notation display formats. Eng (engineering) notation is less than .001, the TI.82 changes to the left of decimal digits you select normal display format, but the answer cannot display in 12346.67. TI-82 Modes The TI.82 has seven MODE settings. Note: If you want and press Í. 1-10...
User Manual
Page 198
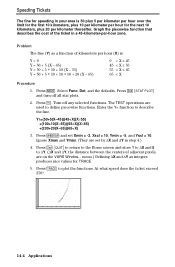
..., Dot, and the defaults. The TEST operations are used to describe the fine. Graph the piecewise function that describes the cost of kilometers per hour (X) is 50 plus 5 per kilometer per hour over the limit for the first 10 kilometers, plus 20 per kilometer thereafter. Press y [STAT PLOT] and turn off any selected...; 65 65 < X Procedure 1. Press z. Turn off all stat plots. 2. Enter the Y= function to define piecewise functions. Speeding Tickets The fine for the next 10 kilometers, plus 10 per kilometer per hour for speeding in a 45-kilometer-per-hour zone.
..., Dot, and the defaults. The TEST operations are used to describe the fine. Graph the piecewise function that describes the cost of kilometers per hour (X) is 50 plus 5 per kilometer per hour over the limit for the first 10 kilometers, plus 20 per kilometer thereafter. Press y [STAT PLOT] and turn off any selected...; 65 65 < X Procedure 1. Press z. Turn off all stat plots. 2. Enter the Y= function to define piecewise functions. Speeding Tickets The fine for the next 10 kilometers, plus 10 per kilometer per hour for speeding in a 45-kilometer-per-hour zone.
User Manual
Page 228
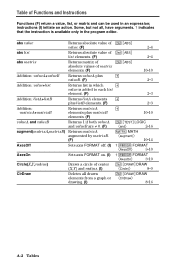
Some, but not all drawn y ãDRAWä DRAW elements from a graph or áClrDrawâ drawing. (I ) initiate an action. instructions (I ) 8.16 A-2 Tables Table of center y ãDRAWä DRAW (X,Y) and radius. (I) áCircle(&#...ä list elements. (F) 2.4 abs matrix Returns matrix of y ãABSä absolute values of matrix elements. (F) 10.10 Addition: valueA+valueB Returns valueA plus à valueB. (F) 2.3 Addition: value+list Returns list in which à value is added to each list element. (F) 2.3 Addition: listA+listB Returns listA elements ...
Some, but not all drawn y ãDRAWä DRAW elements from a graph or áClrDrawâ drawing. (I ) initiate an action. instructions (I ) 8.16 A-2 Tables Table of center y ãDRAWä DRAW (X,Y) and radius. (I) áCircle(&#...ä list elements. (F) 2.4 abs matrix Returns matrix of y ãABSä absolute values of matrix elements. (F) 10.10 Addition: valueA+valueB Returns valueA plus à valueB. (F) 2.3 Addition: value+list Returns list in which à value is added to each list element. (F) 2.3 Addition: listA+listB Returns listA elements ...


