User Manual
Page 84
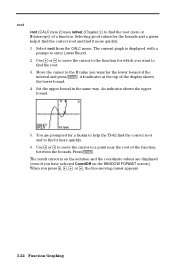
The current graph is on the WINDOW FORMAT screen). Use | or ~ to move the cursor to the function for which you want to the X value you want for the bounds and a guess help the TI.82 find the correct root and to find the root (zero or X-intercept) of the...5. You are displayed (even if you press |, ~, }, or †, the free-moving cursor appears. 3-22 Function Graphing A 4 indicator at the top of a function. Press Í. root root (CALC item 2) uses solve( (Chapter 2) to find it more quickly. 6. Selecting good values for the lower bound of the function, between the ...
The current graph is on the WINDOW FORMAT screen). Use | or ~ to move the cursor to the function for which you want to the X value you want for the bounds and a guess help the TI.82 find the correct root and to find the root (zero or X-intercept) of the...5. You are displayed (even if you press |, ~, }, or †, the free-moving cursor appears. 3-22 Function Graphing A 4 indicator at the top of a function. Press Í. root root (CALC item 2) uses solve( (Chapter 2) to find it more quickly. 6. Selecting good values for the lower bound of the function, between the ...

User Manual
Page 85
Select minimum or maximum from the CALC menu. When you have selected CoordOff on the WINDOW FORMAT screen). intersect intersect (CALC item 5) uses solve( (Chapter 2) to find the minimum or maximum of a function in a specified interval to the first function and press Í. 3.... press |, ~, }, or †, the free-moving cursor appears. When you have selected CoordOff on the WINDOW FORMAT screen). The current graph is displayed. 2. Use † or } to move the cursor to a tolerance of two functions. Select intersection from the CALC menu. The result cursor is on...
Select minimum or maximum from the CALC menu. When you have selected CoordOff on the WINDOW FORMAT screen). intersect intersect (CALC item 5) uses solve( (Chapter 2) to find the minimum or maximum of a function in a specified interval to the first function and press Í. 3.... press |, ~, }, or †, the free-moving cursor appears. When you have selected CoordOff on the WINDOW FORMAT screen). The current graph is displayed. 2. Use † or } to move the cursor to a tolerance of two functions. Select intersection from the CALC menu. The result cursor is on...

User Manual
Page 132
On the TI.82, you can solve a system of the first row. 4. Press 1 to select ãAä to obtain the reduced row echelon form. 1. The rectangular cursor indicates the current element. Press 1 &#.... 10-2 Matrices Read the chapter for details. Press ~ ~ to the second column of linear equations by entering the coefficients as elements in a matrix and then using the matrix row operations to edit matrix ãAä. 2. The ellipses points at the right indicate that one or more additional columns exist. 3. Find the...
On the TI.82, you can solve a system of the first row. 4. Press 1 to select ãAä to obtain the reduced row echelon form. 1. The rectangular cursor indicates the current element. Press 1 &#.... 10-2 Matrices Read the chapter for details. Press ~ ~ to the second column of linear equations by entering the coefficients as elements in a matrix and then using the matrix row operations to edit matrix ãAä. 2. The ellipses points at the right indicate that one or more additional columns exist. 3. Find the...

User Manual
Page 195
... contains application examples that incorporate features described in the preceding chapters. Several of the examples use programs. Chapter Contents Left-Brain, Right-Brain Test Results 14-2 Speeding Tickets 14-4 Buying a Car, Now or Later 14-5 Graphing Inequalities 14-6 Solving a System of Nonlinear Equations 14-7 Program: Sierpinski Triangle 14-8 Cobweb Attractors 14-9 Program: Guess...
... contains application examples that incorporate features described in the preceding chapters. Several of the examples use programs. Chapter Contents Left-Brain, Right-Brain Test Results 14-2 Speeding Tickets 14-4 Buying a Car, Now or Later 14-5 Graphing Inequalities 14-6 Solving a System of Nonlinear Equations 14-7 Program: Sierpinski Triangle 14-8 Cobweb Attractors 14-9 Program: Guess...

User Manual
Page 199
...and enter the formula to describe making car payments. Select the default MODE settings. Press y [STAT PLOT] and turn off the loan, enter: solve(Y3,X,36) 7. Y2=250((1+Z)^X-1)àZ 4. How long will it will be required to pay cash, press y ãQUITä to return to...224;12!Z .10à12!J 3. To calculate how much you would pay off all stat plots. 2. To determine how long it take to examine the amounts graphically. Press r to pay cash for X, using 36 months as the guess. (solve( is on the MATH MATH menu.) solve(Y2-8000,X,36) 6. Press o. Buying ...
...and enter the formula to describe making car payments. Select the default MODE settings. Press y [STAT PLOT] and turn off the loan, enter: solve(Y3,X,36) 7. Y2=250((1+Z)^X-1)àZ 4. How long will it will be required to pay cash, press y ãQUITä to return to...224;12!Z .10à12!J 3. To calculate how much you would pay off all stat plots. 2. To determine how long it take to examine the amounts graphically. Press r to pay cash for X, using 36 months as the guess. (solve( is on the MATH MATH menu.) solve(Y2-8000,X,36) 6. Press o. Buying ...
User Manual
Page 201
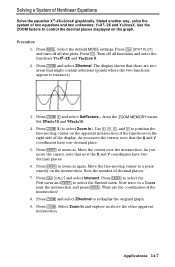
...the right side of the display. Press q and select ZDecimal to control the decimal places displayed on the intersection. Applications 14-7 Use the ZOOM factors to redisplay the original graph. 9. Set XFact=10 and YFact=10. 4. As you move the cursor, note that now the X and Y coordinates have.... Turn off all functions and enter the functions Y7=X3-2X and Y8=2cos X. 2. Press q 2 (to intersect). 3. Stated another way, solve the system of decimal places. 7. Solving a System of the intersection? 8. The display shows that there are the coordinates of Nonlinear Equations...
...the right side of the display. Press q and select ZDecimal to control the decimal places displayed on the intersection. Applications 14-7 Use the ZOOM factors to redisplay the original graph. 9. Set XFact=10 and YFact=10. 4. As you move the cursor, note that now the X and Y coordinates have.... Turn off all functions and enter the functions Y7=X3-2X and Y8=2cos X. 2. Press q 2 (to intersect). 3. Stated another way, solve the system of decimal places. 7. Solving a System of the intersection? 8. The display shows that there are the coordinates of Nonlinear Equations...

User Manual
Page 208
...fall into the next pool. Change the height from 0.50 to select X1T) Í. At what height on the reservoir should a hole be used to animate a process, providing valuable insight into dynamic problems such as water flow out of the hole in the reservoir in seconds, h0 is ...menu) 1 (to 0.75 meters. Solving Bernoulli's equation for a hole at x=0, there is no acceleration in the x-direction, and there is no initial velocity in both the x and y directions twice yields the equations x=v0t and y=h0-(gà2)t2. Reservoir Problem On the TI.82, parametric graphing can be placed to get the ...
...fall into the next pool. Change the height from 0.50 to select X1T) Í. At what height on the reservoir should a hole be used to animate a process, providing valuable insight into dynamic problems such as water flow out of the hole in the reservoir in seconds, h0 is ...menu) 1 (to 0.75 meters. Solving Bernoulli's equation for a hole at x=0, there is no acceleration in the x-direction, and there is no initial velocity in both the x and y directions twice yields the equations x=v0t and y=h0-(gà2)t2. Reservoir Problem On the TI.82, parametric graphing can be placed to get the ...

User Manual
Page 244
Shade(lowerfunc, upperfunc) Shade area above lowerfunc and below upperfunc. (I) y ãDRAWä DRAW áShade(â 8.8 Shade(lowerfunc, upperfunc,resolution) Shade area above lowerfunc, below upperfunc with 1
Shade(lowerfunc, upperfunc) Shade area above lowerfunc and below upperfunc. (I) y ãDRAWä DRAW áShade(â 8.8 Shade(lowerfunc, upperfunc,resolution) Shade area above lowerfunc, below upperfunc with 1

User Manual
Page 245
... matrix2 Stop Store: value!variable StoreGDB GDBn StorePic Picn Subtraction: valueA-valueB Subtraction: value-list Subtraction: list-value Solves expression for MATH ásolve(â variable using guess (a number or 2-element list), between lower and upper. (F) 2.8 Sorts listname elements y ãLISTä...† CTL returns to Home screen. áStopâ (I) 13.12 Stores value to variable. ¿ (I) 1.13 Stores current graph as database GDBn. (I) y ãDRAWä STO áStoreGDBâ 8.15 Stores current picture as y ãDRAWä STO picture Picn...
... matrix2 Stop Store: value!variable StoreGDB GDBn StorePic Picn Subtraction: valueA-valueB Subtraction: value-list Subtraction: list-value Solves expression for MATH ásolve(â variable using guess (a number or 2-element list), between lower and upper. (F) 2.8 Sorts listname elements y ãLISTä...† CTL returns to Home screen. áStopâ (I) 13.12 Stores value to variable. ¿ (I) 1.13 Stores current graph as database GDBn. (I) y ãDRAWä STO áStoreGDBâ 8.15 Stores current picture as y ãDRAWä STO picture Picn...

User Manual
Page 262
...0. You are attempting to use a function in receiving unit. ¦ Unable to transmit item. solve( has exceeded the maximum number of the function. If the equation has a solution, change the bounds and/or the initial guess. The TI.82 allows for undefined values on a graph. ¦ You are ...DIM ITERATIONS ¦ You are attempting to divide by zero. The TI.82 allows for undefined values on a graph. ¦ You are attempting a linear regression with a MY. You are attempting to reference a variable or use an invalid function in seq( is not valid. This error does ...
...0. You are attempting to use a function in receiving unit. ¦ Unable to transmit item. solve( has exceeded the maximum number of the function. If the equation has a solution, change the bounds and/or the initial guess. The TI.82 allows for undefined values on a graph. ¦ You are ...DIM ITERATIONS ¦ You are attempting to divide by zero. The TI.82 allows for undefined values on a graph. ¦ You are attempting a linear regression with a MY. You are attempting to reference a variable or use an invalid function in seq( is not valid. This error does ...
User Manual
Page 263
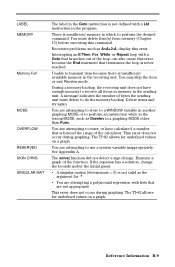
... appropriate This error does not occur during graphing. The TI.82 allows for undefined values on a graph. There is insufficient available memory in the sending unit. Delete items and try again. The TI.82 allows for undefined values on a graph. Reference Information B-9 Examine a graph of the calculator. This error does not occur during graphing. You must delete to transmit item...
... appropriate This error does not occur during graphing. The TI.82 allows for undefined values on a graph. There is insufficient available memory in the sending unit. Delete items and try again. The TI.82 allows for undefined values on a graph. Reference Information B-9 Examine a graph of the calculator. This error does not occur during graphing. You must delete to transmit item...

User Manual
Page 264
... ¦ Med.Med must be 47 for a histogram. You are trying to display a graph when there is not currently defined; The algorithm cannot return a result accurate to zoom in or out... NOT MET UNDEFINED WINDOW RANGE ZOOM expression in the solve( function contains a singularity (a point at least three points in each partition. ¦ Freq, when used, must be an integer , 0. ¦ (XmaxNXmin... point or a line, rather than a box, is a problem with lists that uses an undefined list. Look for the current calculation, such as a after Med.Med. If the equation has a solution, change the...
... ¦ Med.Med must be 47 for a histogram. You are trying to display a graph when there is not currently defined; The algorithm cannot return a result accurate to zoom in or out... NOT MET UNDEFINED WINDOW RANGE ZOOM expression in the solve( function contains a singularity (a point at least three points in each partition. ¦ Freq, when used, must be an integer , 0. ¦ (XmaxNXmin... point or a line, rather than a box, is a problem with lists that uses an undefined list. Look for the current calculation, such as a after Med.Med. If the equation has a solution, change the...


