
StreamSmart 400 User Guide
Page 5
Table of Contents Table of Contents 1 HP Mobile Calculating Laboratory Types of experiments 3 Streaming experiments 4 The StreamSmart Aplet 4 The Statistics Aplet 7 Manual conventions 7 Helpful hints 8 2 Streaming Experiments Viewing a stream of data 12 Low battery symbol 17 Select a set of data 17 Export a data set 19 Analyze experimental data 20 3 Capturing Data from Events Numeric view: the meter mode 25 Set up experiment 26 Monitor and select events 28 Analyze the data 29 Data logging 29 4 Advanced...
Table of Contents Table of Contents 1 HP Mobile Calculating Laboratory Types of experiments 3 Streaming experiments 4 The StreamSmart Aplet 4 The Statistics Aplet 7 Manual conventions 7 Helpful hints 8 2 Streaming Experiments Viewing a stream of data 12 Low battery symbol 17 Select a set of data 17 Export a data set 19 Analyze experimental data 20 3 Capturing Data from Events Numeric view: the meter mode 25 Set up experiment 26 Monitor and select events 28 Analyze the data 29 Data logging 29 4 Advanced...

StreamSmart 400 User Guide
Page 7
..., an HP StreamSmart 400, and either the HP 39gs or HP 40gs graphing calculator with -entry Same as above events StreamSmart captures the dampened oscillations of a vibrating rod. Two students each reading the distance from various locations along a stream; Selected events Displays a live meter read-out for sampling rate. every 30 seconds. 3 Types of experiments The Mobile Laboratory supports a number of different types of coffee...
..., an HP StreamSmart 400, and either the HP 39gs or HP 40gs graphing calculator with -entry Same as above events StreamSmart captures the dampened oscillations of a vibrating rod. Two students each reading the distance from various locations along a stream; Selected events Displays a live meter read-out for sampling rate. every 30 seconds. 3 Types of experiments The Mobile Laboratory supports a number of different types of coffee...

StreamSmart 400 User Guide
Page 8
... Virtual HP 39/40gs Graphing Calculator software for a streaming experiment- Table 1-2 below lists the standard Aplet views and their use the StreamSmart 400 with the StreamSmart Aplet in the StreamSmart Aplet. Visit www.hp.com/calculators to a stream experiment when started. Note that your HP 39/40gs calculator has the latest version of values collected. Visit www.hp.com/ calculators to ensure that the standard Symbolic and Symbolic Setup views are automatically selected, based on...
... Virtual HP 39/40gs Graphing Calculator software for a streaming experiment- Table 1-2 below lists the standard Aplet views and their use the StreamSmart 400 with the StreamSmart Aplet in the StreamSmart Aplet. Visit www.hp.com/calculators to a stream experiment when started. Note that your HP 39/40gs calculator has the latest version of values collected. Visit www.hp.com/ calculators to ensure that the standard Symbolic and Symbolic Setup views are automatically selected, based on...

StreamSmart 400 User Guide
Page 9
... as time graphs • Perform streaming experiments • See Chapter 2, Streaming Experiments for details Numeric S Plot setup (page 1) @R Plot setup (page 2) Numeric setup @S • View up the window for the graphic view of the data stream • Optional: choose stacked display of multiple data streams or overlaid display (superimposed) • Optional: choose data filters for display and export of fixed length (in Table 1-3. HP Mobile Calculating Laboratory Table 1-2 StreamSmart standard views View Name/Key(s) Description Plot • View...
... as time graphs • Perform streaming experiments • See Chapter 2, Streaming Experiments for details Numeric S Plot setup (page 1) @R Plot setup (page 2) Numeric setup @S • View up the window for the graphic view of the data stream • Optional: choose stacked display of multiple data streams or overlaid display (superimposed) • Optional: choose data filters for display and export of fixed length (in Table 1-3. HP Mobile Calculating Laboratory Table 1-2 StreamSmart standard views View Name/Key(s) Description Plot • View...

StreamSmart 400 User Guide
Page 10
Table 1-3 Specific StreamSmart 400 views View Name/Key(s) Sensor setup Description • Select/deselect each channel's sensor • Manually identify a sensor from a list of supported sensors Unit setup Calibrate • Activate/deactivate channels • Select a unit of measurement for sensors with multiple units of measurement available • Select a sensor's channel for software calibration of the sensor • Perform 1-point or 2point software calibration of the...
Table 1-3 Specific StreamSmart 400 views View Name/Key(s) Sensor setup Description • Select/deselect each channel's sensor • Manually identify a sensor from a list of supported sensors Unit setup Calibrate • Activate/deactivate channels • Select a unit of measurement for sensors with multiple units of measurement available • Select a sensor's channel for software calibration of the sensor • Perform 1-point or 2point software calibration of the...
StreamSmart 400 User Guide
Page 11
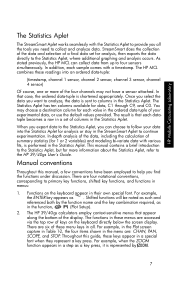
... choose to follow your experimental data, or use the default values provided. Functions on the keyboard directly below the screen display. HP Mobile Calculating Laboratory The Statistics Aplet The StreamSmart Aplet works seamlessly with the Statistics Aplet to provide you all . The Statistics Aplet has ten columns available for analysis or stay in the ordered data-tuple of your data into an ordered data-tuple: (timestamp, channel 1 sensor, channel...
... choose to follow your experimental data, or use the default values provided. Functions on the keyboard directly below the screen display. HP Mobile Calculating Laboratory The Statistics Aplet The StreamSmart Aplet works seamlessly with the Statistics Aplet to provide you all . The Statistics Aplet has ten columns available for analysis or stay in the ordered data-tuple of your data into an ordered data-tuple: (timestamp, channel 1 sensor, channel...
StreamSmart 400 User Guide
Page 12
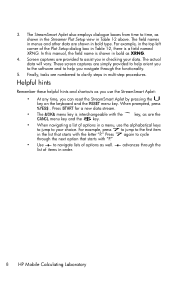
... in order. 8 HP Mobile Calculating Laboratory In this manual, the field name is shown in bold as shown in the Streamer Plot Setup view in Table 1-2 above. For example, press 7 to jump to your data. Screen captures are shown in multi-step procedures. 3. Press 7 again to cycle through the next option that starts with "P." • Use + to assist you can reset the StreamSmart Aplet...
... in order. 8 HP Mobile Calculating Laboratory In this manual, the field name is shown in bold as shown in the Streamer Plot Setup view in Table 1-2 above. For example, press 7 to jump to your data. Screen captures are shown in multi-step procedures. 3. Press 7 again to cycle through the next option that starts with "P." • Use + to assist you can reset the StreamSmart Aplet...

StreamSmart 400 User Guide
Page 16
...: • TABLE: scroll through the table of data using W, X, Z, and Y • GRAPH: graph data using V Auto Scale • 1VAR/2VAR: toggle between analysis of 1-variable and 2-variable data • STATS: view summary statistics • MORE: see on screen: • Numeric view of the Statistics Aplet, with data in columns Figure 2-6 Analyze the data What I see the HP 39/40gs User Guide for details on how to identify a sensor. The StreamSmart Aplet also sets the...
...: • TABLE: scroll through the table of data using W, X, Z, and Y • GRAPH: graph data using V Auto Scale • 1VAR/2VAR: toggle between analysis of 1-variable and 2-variable data • STATS: view summary statistics • MORE: see on screen: • Numeric view of the Statistics Aplet, with data in columns Figure 2-6 Analyze the data What I see the HP 39/40gs User Guide for details on how to identify a sensor. The StreamSmart Aplet also sets the...

StreamSmart 400 User Guide
Page 17
... student can choose other words, StreamSmart filters the data by using averages. The screens shown in the data stream. !EXPRT replaces the \SCOPE function once streaming is stopped; At this rate and display resolution, if each pixel represent a larger and larger data set of the menu key functions. Streaming Experiments Data streams in at up to 5,700 samples per second! To slow the stream down enough...
... student can choose other words, StreamSmart filters the data by using averages. The screens shown in the data stream. !EXPRT replaces the \SCOPE function once streaming is stopped; At this rate and display resolution, if each pixel represent a larger and larger data set of the menu key functions. Streaming Experiments Data streams in at up to 5,700 samples per second! To slow the stream down enough...
StreamSmart 400 User Guide
Page 19
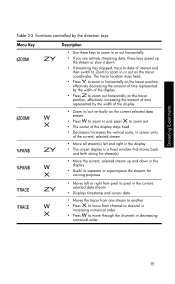
... numerical order 15 Streaming Experiments Table 2-3 Functions controlled by the width of the current, selected stream • Move all stream(s) left and right in the display • The screen display is a fixed window that moves back and forth along the stream(s) • Move the current, selected stream up and down • If streaming has stopped, trace to data...
... numerical order 15 Streaming Experiments Table 2-3 Functions controlled by the width of the current, selected stream • Move all stream(s) left and right in the display • The screen display is a fixed window that moves back and forth along the stream(s) • Move the current, selected stream up and down • If streaming has stopped, trace to data...

StreamSmart 400 User Guide
Page 21
... back. 17 Table 2-4 Menu keys, page 2 Menu Key @MRK$ @SWAP! @GOTO@ \SETUP %ADD$ Description Toggles Mark mode on the current, selected stream. Low battery symbol The low battery symbol (¤) on changing the battery, see the section titled, Replacing the battery in the Statistics Aplet. Returns to a specific time along the current stream. Streaming Experiments Figure 2-10 The low battery symbol Select a set of higher power probes, be sure the StreamSmart has a fresh battery. Note that...
... back. 17 Table 2-4 Menu keys, page 2 Menu Key @MRK$ @SWAP! @GOTO@ \SETUP %ADD$ Description Toggles Mark mode on the current, selected stream. Low battery symbol The low battery symbol (¤) on changing the battery, see the section titled, Replacing the battery in the Statistics Aplet. Returns to a specific time along the current stream. Streaming Experiments Figure 2-10 The low battery symbol Select a set of higher power probes, be sure the StreamSmart has a fresh battery. Note that...

StreamSmart 400 User Guide
Page 25
... the data in a table. use X and W to study. If set to press V and select the Autoscale option. The easiest way to see the fit model plotted with your data is to !2VARqqq! , you enter manually. and then $@FIT#@ to toggle between any two columns of your data. Table 2-8 Views in the Statistics Aplet Symbolic Plot Numeric Figure 2-14 Define an Figure 2-15 Statistical Figure 2-16 Table of data...
... the data in a table. use X and W to study. If set to press V and select the Autoscale option. The easiest way to see the fit model plotted with your data is to !2VARqqq! , you enter manually. and then $@FIT#@ to toggle between any two columns of your data. Table 2-8 Views in the Statistics Aplet Symbolic Plot Numeric Figure 2-14 Define an Figure 2-15 Statistical Figure 2-16 Table of data...

StreamSmart 400 User Guide
Page 28
... current data set • SETUP: select experiment type and destination for data • PROBE: manually identify a channel's sensor • UNIT: change units of measurement for manually adding a numeric entry • Select to just collect the data from each event, auto-number each event, or add a numeric entry to each step in experiments in which you wish to view and analyze the current data set 24 Capturing Data...
... current data set • SETUP: select experiment type and destination for data • PROBE: manually identify a channel's sensor • UNIT: change units of measurement for manually adding a numeric entry • Select to just collect the data from each event, auto-number each event, or add a numeric entry to each step in experiments in which you wish to view and analyze the current data set 24 Capturing Data...

StreamSmart 400 User Guide
Page 30
... stored in the Statistics Aplet. You can choose which channels are active and where the data from Events Table 3-2 lists the menu keys and their functions for your data will be stored on Row 2 of the StreamSmart 400. The Capture Events menu lets you set up experiment By default, pressing the %ADD$ menu key will capture the current set • See the section below titled, Set up experiment • Manually...
... stored in the Statistics Aplet. You can choose which channels are active and where the data from Events Table 3-2 lists the menu keys and their functions for your data will be stored on Row 2 of the StreamSmart 400. The Capture Events menu lets you set up experiment By default, pressing the %ADD$ menu key will capture the current set • See the section below titled, Set up experiment • Manually...

StreamSmart 400 User Guide
Page 32
... 3-8 Event Method field Figure 3-9 Event Method options Press the $OK% menu key to accept your new selection, or the CANCL menu key to keep the current selection and return to the Numeric view. If you can always just start by collecting data using the default ...ADD# menu key. Press $OK% to accept all your changes at any numerical entries to the events (Event Only). Press the CHOOS menu key to make a selection from Events Of course, you can choose any other column for data from the sensor in Channel 2. Pressing the CHOOS menu key drops down a list of the StreamSmart 400...
... 3-8 Event Method field Figure 3-9 Event Method options Press the $OK% menu key to accept your new selection, or the CANCL menu key to keep the current selection and return to the Numeric view. If you can always just start by collecting data using the default ...ADD# menu key. Press $OK% to accept all your changes at any numerical entries to the events (Event Only). Press the CHOOS menu key to make a selection from Events Of course, you can choose any other column for data from the sensor in Channel 2. Pressing the CHOOS menu key drops down a list of the StreamSmart 400...
StreamSmart 400 User Guide
Page 38
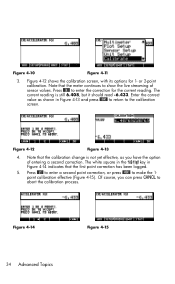
... sensor values. Figure 4-14 Figure 4-15 34 Advanced Topics Note that the first point correction has been logged. 5. Note that the meter continues to enter the correction for 1- The white square in Figure 4-13 and press $OK# to return to make the 1point calibration effective (Figure 4-15). Figure 4-10 Figure 4-11 h3. Figure 4-12 shows the calibration screen...
... sensor values. Figure 4-14 Figure 4-15 34 Advanced Topics Note that the first point correction has been logged. 5. Note that the meter continues to enter the correction for 1- The white square in Figure 4-13 and press $OK# to return to make the 1point calibration effective (Figure 4-15). Figure 4-10 Figure 4-11 h3. Figure 4-12 shows the calibration screen...

StreamSmart 400 User Guide
Page 44
... . Oscilloscope mode While streaming data in sweeps. When the stream hits the right edge of the display, it again to return to meet your data stream. A descending trigger starts the sweep when the data values first drop below the trigger value. This menu key is plotted where the dotted trigger lines intersect. The operation of your specific needs rather easily. With no trigger set the location...
... . Oscilloscope mode While streaming data in sweeps. When the stream hits the right edge of the display, it again to return to meet your data stream. A descending trigger starts the sweep when the data values first drop below the trigger value. This menu key is plotted where the dotted trigger lines intersect. The operation of your specific needs rather easily. With no trigger set the location...

StreamSmart 400 User Guide
Page 45
... StreamSmart 400 to set the x- For further information regarding the virtual HP 39/40gs Graphing Calculator software for the PC. Use the direction keys to your PC, launch the virtual HP 39/ 40gs Graphing Calculator application, and start the StreamSmart Aplet. This use is effective when demonstrating the StreamSmart 400 to USB cable. Table 4-3 Oscilloscope menu keys, page 1 Menu Key Description This key displays the second page of the oscilloscope menu. The StreamSmart 400 connects to a PC using...
... StreamSmart 400 to set the x- For further information regarding the virtual HP 39/40gs Graphing Calculator software for the PC. Use the direction keys to your PC, launch the virtual HP 39/ 40gs Graphing Calculator application, and start the StreamSmart Aplet. This use is effective when demonstrating the StreamSmart 400 to USB cable. Table 4-3 Oscilloscope menu keys, page 1 Menu Key Description This key displays the second page of the oscilloscope menu. The StreamSmart 400 connects to a PC using...

StreamSmart 400 User Guide
Page 54
... interference that may void the user's authority to provide reasonable protection against harmful interference in a particular installation. Declaration of Conformity for help. These limits are not related to this device must be determined by turning the equipment off and on a circuit different from that are designed to operate the equipment. Operation is encouraged to try to...
... interference that may void the user's authority to provide reasonable protection against harmful interference in a particular installation. Declaration of Conformity for help. These limits are not related to this device must be determined by turning the equipment off and on a circuit different from that are designed to operate the equipment. Operation is encouraged to try to...

StreamSmart 400 User Guide
Page 60
... specific views 6 menu keys 40 with virtual calculators 41 trigger 40 StreamSmart 400 Oscilloscope mode 40 connecting 9 S StreamSmart Aplet 4 Sensor specific views 6 calibration 33 standard views 5 calibration of offset, slope 33 V manually choose sensors 31 Virtual Graphing Calculator 41 manually select sensor units 32 setup 31 Statistics views in the Statistics Aplet 21 Statistics Aplet 7 Stream 3 events-with-entry 3 export data from 18 keys after 14 keys during 14 log 3 select data for 17 select events 3 setting the...
... specific views 6 menu keys 40 with virtual calculators 41 trigger 40 StreamSmart 400 Oscilloscope mode 40 connecting 9 S StreamSmart Aplet 4 Sensor specific views 6 calibration 33 standard views 5 calibration of offset, slope 33 V manually choose sensors 31 Virtual Graphing Calculator 41 manually select sensor units 32 setup 31 Statistics views in the Statistics Aplet 21 Statistics Aplet 7 Stream 3 events-with-entry 3 export data from 18 keys after 14 keys during 14 log 3 select data for 17 select events 3 setting the...


