User Guide
Page 50
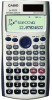
...), or 7(Distr) on the STAT menu while a single-variable statistical calculation type is selected. See Appendix for information about the calculation formula used for normal distribution calculations • For more information, see "Commands when Linear Regression Calculation (A+BX) Is Selected" and "Commands when Quadratic Regression Calculation (_+CX2) Is Selected". Sum Sub...
...), or 7(Distr) on the STAT menu while a single-variable statistical calculation type is selected. See Appendix for information about the calculation formula used for normal distribution calculations • For more information, see "Commands when Linear Regression Calculation (A+BX) Is Selected" and "Commands when Quadratic Regression Calculation (_+CX2) Is Selected". Sum Sub...
User Guide
Page 51
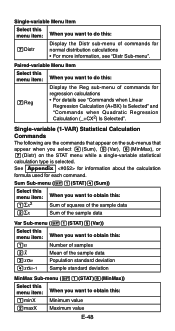
...: {1, 2, 1, 2, 2, 2, 3, 4, 2, 1} (FREQ: ON) • Examples through all use the same data as Example . Calculate minimum value and maximum value. Standard Normal Distribution P (t) Q (t) R (t) 0 t 0 t 0 t Appendix Single-variable Statistical Calculation Select single-variable (1-VAR) and input the following data: {1, 2, 3, 4, 5, 6, 7, ... shown below . Calculate sum of squares of the sample data and sum of standard normal distribution. Performing standard normal distribution approximation on the input sample data (from the data input on the STAT editor screen....
...: {1, 2, 1, 2, 2, 2, 3, 4, 2, 1} (FREQ: ON) • Examples through all use the same data as Example . Calculate minimum value and maximum value. Standard Normal Distribution P (t) Q (t) R (t) 0 t 0 t 0 t Appendix Single-variable Statistical Calculation Select single-variable (1-VAR) and input the following data: {1, 2, 3, 4, 5, 6, 7, ... shown below . Calculate sum of squares of the sample data and sum of standard normal distribution. Performing standard normal distribution approximation on the input sample data (from the data input on the STAT editor screen....


