
Casio FX-9750GII-SC Support Question
Casio FX-9750GII-SC Support Question
Find answers below for this question about Casio FX-9750GII-SC - Fx-9750gii-ih Graphing Calculator-yellow Sch.Need a Casio FX-9750GII-SC manual? We have 1 online manual for this item!
Question posted by swikee on May 27th, 2014
How To Graph Cubic Regression On Fx9750gii
The person who posted this question about this Casio product did not include a detailed explanation. Please use the "Request More Information" button to the right if more details would help you to answer this question.
Current Answers
Related Casio FX-9750GII-SC Manual Pages
User Guide - Page 10
...2nd to draw statistical graphs.
EQUA (Equation)
PRGM (Program)
Use this mode to perform single-variable (standard deviation) and paired-variable (regression) statistical calculations, to perform tests,... the STAT mode.
• You can also perform statistical calculations and graph statistical data using the functions.
Icon
Mode Name
RUN (fx-7400Gɉ only)
RUN • MAT*1 (Run &#...
User Guide - Page 30
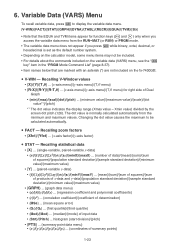
... not appear if you press ) while binary, octal, decimal, or hexadecimal is normally calculated automatically from the minimum and maximum values. S V-WIN - Recalling statistical data •...}/{minimum value}/{maximum value}
• {GRPH} ... {graph data menu}
• {a}/{b}/{c}/{d}/{e} ... {regression coefficient and polynomial coefficients} • {r}/{r2} ... {...fx-7400Gɉ. 6.
User Guide - Page 128
..., n • Linear three-term recursion composed of an+2, an+1, an, n
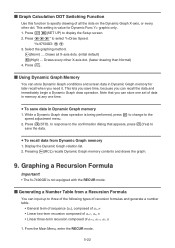
1. I Graph Calculation DOT Switching Function
Use this function to specify drawing of all X-axis dots. (initial default) ... the data and immediately begin a Dynamic Graph draw operation. Display the Dynamic Graph relation list. 2. Graphing a Recursion Formula
Important! • The fx-7400Gɉ is being performed, press ...
User Guide - Page 142
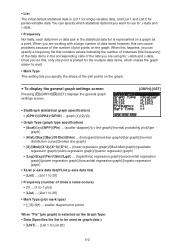
... curve}/{broken line graph} • {X}/{Med}/{X^2}/{X^3}/{X^4} ... {linear regression graph}/{Med-Med graph}/{quadratic
regression graph}/{cubic regression graph}/{quartic regression graph} • {Log}/{Exp}/{Pwr}/{Sin}/{Lgst} ... {logarithmic regression graph}/{exponential regression
graph}/{power regression graph}/{sinusoidal regression graph}/{logistic regression graph}
• XList (x-axis...
User Guide - Page 150
...^x}/{Pwr}/{Sin}/{Lgst} ... {linear regression (ax+b form)}/{linear regression (a+bx form)}/{Med-Med}/{quadratic
regression}/{cubic regression}/{quartic regression}/{logarithmic regression}/{exponential
regression (aebx form)}/{exponential regression (abx form)}/{power regression}/
{sinusoidal regression}/{logistic regression} calculation and graphing
• {2VAR}... {paired-variable statistical...
User Guide - Page 151
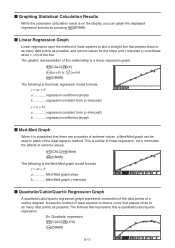
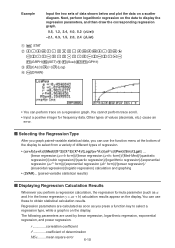
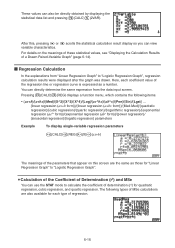
... y-intercept (y-coordinate when x = 0) of this is the Med-Med graph model formula. Ex. I Graphing Statistical Calculation Results
While the parameter calculation result is the linear regression model formula.
The graphic representation of the line. y = ax + b a Med-Med graph slope b Med-Med graph y-intercept
I Med-Med Graph
When it minimizes the effects of extreme values.
(CALC...
User Guide - Page 152
...is the exponential regression model formula. y = a·ebx a regression coefficient b regression constant term
y = a·bx a regression constant term b regression coefficient
6-12 regression constant term (y-intercept)
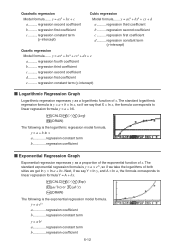
c .......... The standard exponential regression formula is the logarithmic regression model formula. y = ax2 + bx + c
Cubic regression
Model formula....... y = ax3...
User Guide - Page 153
... does not indicate malfunction.
The angle unit does not change to calculate.
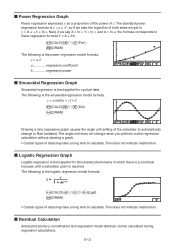
I Sinusoidal Regression Graph
Sinusoidal regression is the logistic regression model formula. The following is reached. y = a·xb a regression coefficient b regression power
I Logistic Regression Graph
Logistic regression is best applied for cyclical data.
y = a·sin(bx + c) + d
(CALC...
User Guide - Page 156
..."Logistic Regression Graph", regression calculation results were displayed after the graph was drawn. The following items.
• {ax+b}/{a+bx}/{Med}/{X^2}/{X^3}/{X^4}/{Log}/{ae^bx}/{ab^x}/{Pwr}/{Sin}/{Lgst} ... {linear regression (ax+b form)}/{linear regression (a+bx form)}/{Med-Med}/{quadratic
regression}/{cubic regression}/{quartic regression}/{logarithmic regression}/{exponential
regression...
User Guide - Page 157

... to appear.
2. After drawing a regression graph, press (G-SLV)(Y-CAL) to enter the graph selection mode, and then press U. • Linear Regression (ax + b MSe =
1 n - 2
n i=1
(yi - (axi + b))2
(a + bx MSe =
1 n - 2
n
(yi - (a + bxi))2
i=1
• Quadratic Regression MSe =
1 n - 3
n
(yi - (axi2+ bxi + c))2
i=1
• Cubic Regression MSe =
1 n - 4
n i=1
(yi - (axi3...
User Guide - Page 158
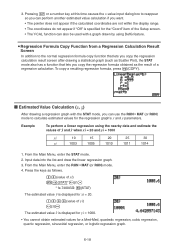
...STAT)*(ţ)U
* fx-7400GII: (STAT) The estimated value ţ is displayed for a Med-Med, quadratic regression, cubic regression, quartic regression, sinusoidal regression, or logistic regression graph.
6-18
Press the keys as the result of the Setup screen. • The Y-CAL function can also be used with the STAT mode, you can perform another estimated value calculation if you copy...
User Guide - Page 237
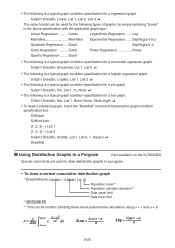
..., List 1, List 2, 1, Square = DrawStat
I Using Distribution Graphs in a Program
(Not available on the fx-7400GII)
Special commands are used for a bar graph. Cubic
Power Regression Power
Quartic Regression ........ S-Gph1 DrawOn, Pie, List 1, %, None =
• The following is a typical graph condition specification for the following types of graphs, by simply replacing "Linear" in...
User Guide - Page 239
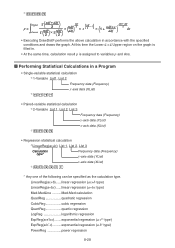
...(a+bx type)
Med-MedLine ..........Med-Med calculation QuadReg quadratic regression CubicReg cubic regression QuartReg quartic regression LogReg logarithmic regression
ExpReg(a·eˆbx)........exponential regression (a·ebx type) ExpReg(a·bˆx)..........exponential regression (a·bx type)
PowerReg power regression
8-28
p =
Upper
ndf + ddf 2
Lower
ndf...
User Guide - Page 269
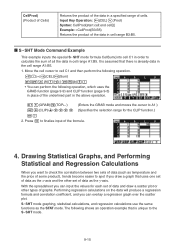
... the cell cursor to the S • SHT mode.
9-15 With the spreadsheet you can input the values for the CLIP function.)
U
2. S • SHT mode graphing, statistical calculations, and regression calculations use the same functions as the y-axis. It is assumed that is unique to cell C1 and then perform the following operation.
(CEL)(Sum...
User Guide - Page 276
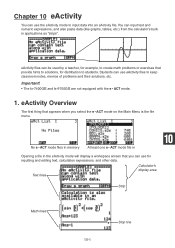
... a teacher, for example, to students.
Important! • The fx-7400GII and fx-9750GII are not equipped with the e • ACT mode.
1. eActivity Overview
The first thing that appears when you can input text and numeric expressions, and also paste data (like graphs, tables, etc.) from the calculator's builtin applications as "strips". You can use for...
User Guide - Page 313

... OS 2.0 Calculator (except the fx-9750GII/fx7400GII to Z, r, Ƨ) with a complex number assigned
• Answer Memory • Capture memory data • Clipboard, replay, and history data (Including the "SYSTEM" data item.) • CONICS mode data*1 • DYNA mode data*1 • E-CON2 mode data*1 • EQUA mode data • Function memory data • Graph memory...
User Guide - Page 323
...the input expression.
No variable specified within a graph function being sent is
size that is nothing wrong with more than 256 lines from the fx-9750GII to List 6.
• Specify a data number ...
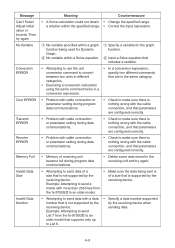
Memory Full
Invalid Data Size
Invalid Data Number
Meaning
Countermeasure
• A Solve calculation could not obtain • Change the specified range. Example: Attempting to send data...
User Guide - Page 329
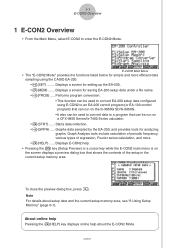
... displays a preview dialog box that shows the contents of regression, Fourier series calculation, and more efficient data sampling using E-CON2 to an EA...fx-7400 Series calculator. • 4(STRT) ...... E-CON2 Main Menu
• The "E-CON2 Mode" provides the functions listed below for saving EA-200 setup data under a file name. • 3(PROG) .....
Graph Analysis tools include calculation...
User Guide - Page 381
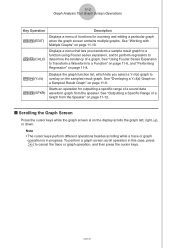
... operation in progress. K5(Y=fx)
Displays the graph function list, which lets you transform a sample result graph to a function using Fourier series expansion, and to perform regression to a Function" on page 11-6, and "Performing Regression" on page 11-9. Starts an operation for zooming and editing a particular graph when the graph screen contains multiple graphs.
See "Using Fourier...
User Guide - Page 387

... used to perform the other types of regression. For details about these regression types, see page 6-3-5 through 6-3-10 of the display.
2. On the graph screen, press K, and then 4(CALC). • The [CALC] menu appears at the bottom of the manual that comes with the fx-9860G SD/fx-9860G calculator. Move the trace pointer to the...
Similar Questions

How To Graph Tan On Casio Fx-9750gii
(Posted by toniaArcala 9 years ago)

How To Find Cubic Regression Equation On Casio Fx9750gii
(Posted by giaacss 9 years ago)

Casio Graphing Calculator Fx-9750gii How To Put In Degree Mode
(Posted by highgFishf 9 years ago)


Casio Fx-cg10 Graphing Calculator How To Graph An Absolute Value Function
(Posted by ADEzophar 10 years ago)