Casio FX9750GII Support Question
Find answers below for this question about Casio FX9750GII - 0CALCULATOR GRAPHIC.Need a Casio FX9750GII manual? We have 1 online manual for this item!
Question posted by Clarisnip on February 28th, 2014
How To Do Normal Distribution On A Casio Fx-9750gii
The person who posted this question about this Casio product did not include a detailed explanation. Please use the "Request More Information" button to the right if more details would help you to answer this question.
Current Answers
There are currently no answers that have been posted for this question.
Be the first to post an answer! Remember that you can earn up to 1,100 points for every answer you submit. The better the quality of your answer, the better chance it has to be accepted.
Be the first to post an answer! Remember that you can earn up to 1,100 points for every answer you submit. The better the quality of your answer, the better chance it has to be accepted.
Related Casio FX9750GII Manual Pages
User Guide - Page 38


... and return all important data. S Reset
Use reset when you can restart it by pressing the RESTART button (P button). Normally, pressing the RESTART button reboots the calculator's operating system, so programs, graph functions and other data, any data that memory contents will be corrupted or lost entirely.
• You will be able...
User Guide - Page 50
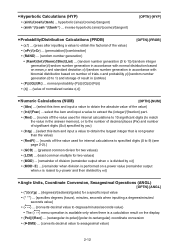

... integer generation}/{random number generation in accordance with normal distribution based
on mean ƫ and standard deviation Ʊ}/{random number generation in ListAns}
• {P(}/{Q(}/{R(} ... select the item and input a value to extract the {integer}/{fraction} part.
• {Rnd} ... {rounds off the value used for internal calculations to 10 significant digits (to match the...
User Guide - Page 54
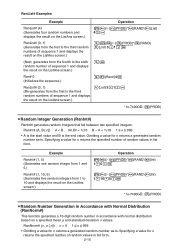

...Operation *(E)(PROB)*(RAND)(Int) 1
5U
*(E)(PROB)*(RAND)(Int) 1
10
5U
* fx-7400GII: (PROB)
S Random Number Generation in Accordance with Normal Distribution (RanNorm#)
This function generates a 10-digit random number in accordance with normal distribution
based on the ListAns screen.)
(List) 3
1U
* fx-7400GII: (PROB)
S Random Integer Generation (RanInt#)
RanInt# generates random...
User Guide - Page 55
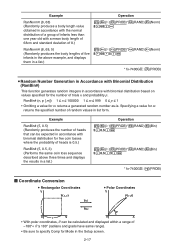

...RanNorm# (8, 68) (Randomly produces a body length value obtained in accordance with the normal distribution of a group of infants less than one year old with a mean body length ...*(E)(PROB)*(RAND)(Bin) 5
0.5
3U
* fx-7400GII: (PROB)
I Coordinate Conversion
S Rectangular Coordinates
S Polar Coordinates
• With polar coordinates, Ƨ can be calculated and displayed within a range of ...
User Guide - Page 144
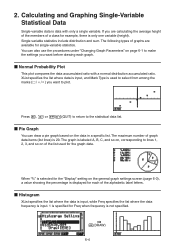

... the marks {U / s / • } you want before drawing each of graphs are calculating the average height of the members of graph data items (list lines) is only one variable ... statistics include distribution and sum. The graph is data with a normal distribution accumulated ratio. You can draw a pie graph based on , corresponding to the statistical data list. Calculating and Graphing ...
User Guide - Page 146
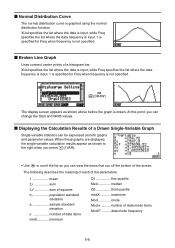

... calculation results...Calculation Results of a Drawn Single-Variable Graph
Single-variable statistics can change the Start and Width values. XList specifies the list where the data is input, while Freq specifies the list where the data frequency is input. 1 is specified for Freq when frequency is graphed using the normal distribution function. I Normal Distribution Curve
The normal distribution...
User Guide - Page 159
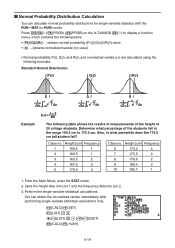

...the students fall ? Height (cm) Frequency
6
173.3
4
7
175.5
2
8
178.6
2
9
180.4
2
10
186.7
1
1. You can calculate normal probability distributions for single-variable statistics with the RUN • MAT (or RUN) mode. Class no .
Standard Normal Distribution
P (t)
Q (t)
R (t)
0t
0t
0t
Example
x
The following formulas.
Determine what percentile does the 175.5 cm...
User Guide - Page 163

....
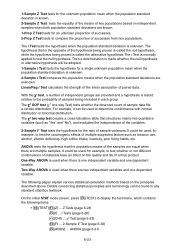
1-Sample t Test tests the hypothesis for example, to determine conformance with normal distribution or binomial distribution. On the initial STAT mode screen, press (TEST) to compare the proportion of a final product. C2 Test (page 6-29)
(F) ... 2-Sample F Test (page 6-30)
(ANOV) ...
LinearReg t Test calculates the strength of the linear association of the samples are equal...
User Guide - Page 164

... variables Z
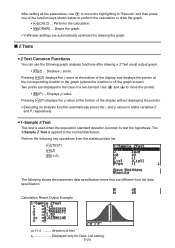
and P, respectively. Calculation Result Output Example
Mx11.4 ..........
Use B and C to move the highlighting to "Execute" and then press one of the function keys shown below to test the hypothesis. Perform the following key operations from list data specification. I Z Tests
S Z Test Common Functions
You can use A to the normal distribution.
S 1-Sample Z Test
This...
User Guide - Page 165
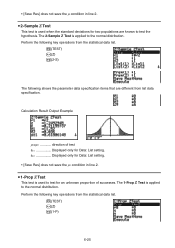

... in line 2. S 2-Sample Z Test
This test is applied to the normal distribution. Perform the following key operations from the statistical data list. (TEST) (Z) (2-S)
The following key operations from list data specification. • [Save Res] does not save the M1 condition in line 2.
Calculation Result Output Example
M1xM2 direction of successes.
The 2-Sample Z Test...
User Guide - Page 166
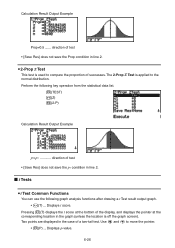

... the statistical data list.
(TEST) (Z) (2-P)
Calculation Result Output Example
p1>p2 direction of test • [Save Res] does not save the p1 condition in line 2. Use B and C to the
normal distribution. direction of test • [Save Res] ... following graph analysis functions after drawing a t Test result output graph. • (T) ... Calculation Result Output Example
Propx0.5 .......
User Guide - Page 169
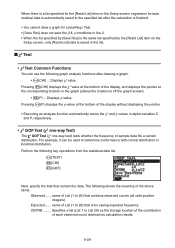

...shows the meaning of sample data fits a certain
distribution. name of the display, and displays the pointer...calculation results.
6-29 Specifies a list (List 1 to the specified list after drawing a graph. • (CHI) ...
name of each observed count obtained as the storage location of the contribution
of List (1 to determine conformance with normal distribution or binomial distribution...
User Guide - Page 178
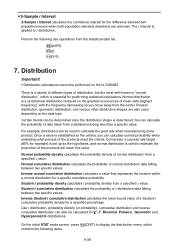

... shape is a variety of different types of data taken from a distribution being less than a specific value.
Inverse normal cumulative distribution calculates a value that represents the location within a normal distribution for performing statistical calculations.
Normal distribution is established as you can also be performed on the fx-7400GII. You can be used to display the...
User Guide - Page 179


....
• Executing an analysis function automatically stores the x and p values in list form.
(DIST)(NORM)(NPd)
6-39 I Normal Distribution
• Normal Probability Density
Normal Probability Density calculates the probability
density (p) for graph drawing are finished, press ) to calculate an estimated p-value for graph drawing when the "Stat Wind" setting is "Auto". After drawing...
User Guide - Page 180
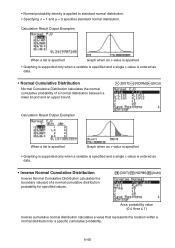

... when an x-value is specified
• Graphing is supported only when a variable is specified and a single x-value is applied to standard normal distribution.
• Specifying Ʊ = 1 and ƫ = 0 specifies standard normal distribution. Calculation Result Output Examples
When a list is specified
Graph when an x-value is specified
• Graphing is supported only when a variable is...
User Guide - Page 228

... calculation result is displayed.
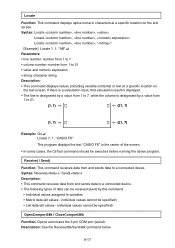
• The line is designated by a value from 1 to 7, while the column is designated by a value from and sends data to a connected device. • The following types of data can be received (sent) by this command.
• Individual values assigned to 21.
(1, 1)
(21, 1)
(1, 7)
(21, 7)
Example: Cls= Locate 7, 1, "CASIO FX...
User Guide - Page 236
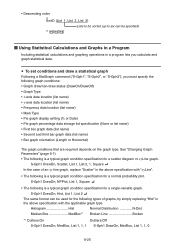

...graph conditions that are required depends on the graph type.
Histogram Hist
Normal Distribution N-Dist
Median Box MedBox*1 Broken Line Broken
*1 Outliers:On
Outliers:Off...Calculations and Graphs in a Program
Including statistical calculations and graphing operations in the above specification with "xyLine".
• The following is a typical graph condition specification for a normal...
User Guide - Page 240

... 2
y-axis data (YList) x-axis data (XList)
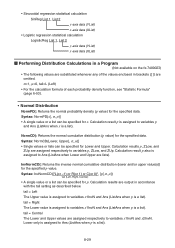
I Performing Distribution Calculations in a Program
(Not available on the fx-7400GII)
• The following values are substituted whenever any of each probability density function, see "Statistic Formula" (page 6-53).
• Normal Distribution NormPD(: Returns the normal probability density (p value) for x.
Syntax: NormPD(x[, S, ƫ)] •...
User Guide - Page 243
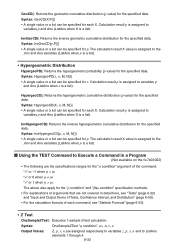

... arguments that are not covered in a Program
(Not available on the fx-7400GII)
• The following are assigned respectively to variables z, p, M, n and to Execute a Command in detail here, see "Tests" (page 6-22) and "Input and Output Terms of Tests, Confidence Interval, and Distribution" (page 6-50).
• For the calculation formula of the command.
User Guide - Page 314
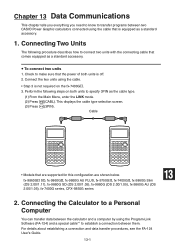

... to transfer programs between two CASIO Power Graphic calculators connected using the Program-Link Software (FA-124) and a special cable*1 to establish a connection between the calculator and a computer by using the cable that comes equipped as a standard accessory.
1. S To connect two units
1.
fx-9860GII SD, fx-9860GII, fx-9860G AU PLUS, fx-9750GII, fx-7400GII, fx-9860G Slim
(OS 2.00/1.11...
Similar Questions
How To Find The Mean Probability Distribution On A Fx-9750gii
(Posted by littmik 9 years ago)
How To Put Snake On A Graphics Calculator Casio Fx-9750gii
(Posted by mfumatil 9 years ago)
How To Calculate Normal Distribution Statistics On Casio Fx-115es
(Posted by jimbster 9 years ago)
How To Do Cumulative Distribution Function With A Fx-9750gii
(Posted by Mawande 9 years ago)
How To Calculate Normal Distribution In Calci-fx-991ms
??
(Posted by veda9590 10 years ago)

