
User Manual
Page 115
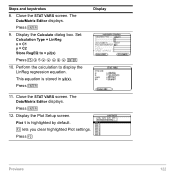
Steps and keystrokes Display 2. Clear the Y= Editor and turn off any stat data plots. A thick border around the Y= Editor indicates it is now around the Y= Editor. When active, its entry line goes all the way across .... Press 2 a C ¸ A B B 0 5 ¸ Previews 115 Press , 8 ¸ ‡ 5 ¸ .1 X Z 3 | 2 X « 6 ¸ 3. Switch to the Y= Editor and edit y1(x) to change .1x3 to the Graph screen and graphs the function. The thick border is the second function of O. Press „ 6 4. Select the ZoomStd viewing window, which switches to .5x3. 2 a is around the...
Steps and keystrokes Display 2. Clear the Y= Editor and turn off any stat data plots. A thick border around the Y= Editor indicates it is now around the Y= Editor. When active, its entry line goes all the way across .... Press 2 a C ¸ A B B 0 5 ¸ Previews 115 Press , 8 ¸ ‡ 5 ¸ .1 X Z 3 | 2 X « 6 ¸ 3. Switch to the Y= Editor and edit y1(x) to change .1x3 to the Graph screen and graphs the function. The thick border is the second function of O. Press „ 6 4. Select the ZoomStd viewing window, which switches to .5x3. 2 a is around the...
User Manual
Page 122
... 11. Plot 1 is stored in y2(x). lets you clear highlighted Plot settings. Press ¸ 9. Display the Calculate dialog box. Close the STAT VARS screen. The Data/Matrix Editor displays. Display the Plot Setup screen. Close the STAT VARS screen. This equation is highlighted by default. ... The Data/Matrix Editor displays. Press ¸ 12...
... 11. Plot 1 is stored in y2(x). lets you clear highlighted Plot settings. Press ¸ 9. Display the Calculate dialog box. Close the STAT VARS screen. The Data/Matrix Editor displays. Display the Plot Setup screen. Close the STAT VARS screen. This equation is highlighted by default. ... The Data/Matrix Editor displays. Press ¸ 12...

User Manual
Page 124
... you may need to move the cursor to y1. Use ZoomData to Dot. For y1(x), the MedMed regression equation, set the display style to graph Plot 1 and the regression equations y1(x) and y2(x). Notice that Plot 1 is the same as on the previous contents of the screen means that... y1(x) and y2(x) were selected when the regression equations were stored. Scroll up to include all selected stat plots and adjusts the viewing window to highlight Plot 1. The displayed shorthand definition is selected. ZoomData examines the data for all points. Display ...
... you may need to move the cursor to y1. Use ZoomData to Dot. For y1(x), the MedMed regression equation, set the display style to graph Plot 1 and the regression equations y1(x) and y2(x). Notice that Plot 1 is the same as on the previous contents of the screen means that... y1(x) and y2(x) were selected when the regression equations were stored. Scroll up to include all selected stat plots and adjusts the viewing window to highlight Plot 1. The displayed shorthand definition is selected. ZoomData examines the data for all points. Display ...
User Manual
Page 190
.... • Turns off all functions and stat plots (FnOff and PlotsOff) in the current graphing mode. • Performs ClrDraw, ClrErr, ClrGraph, ClrHome, ClrIO, and ClrTable. To prevent this lets you restore the default. NewProb performs a variety of the variables have already been assigned a value, your calculation may produce misleading results. You must then...
.... • Turns off all functions and stat plots (FnOff and PlotsOff) in the current graphing mode. • Performs ClrDraw, ClrErr, ClrGraph, ClrHome, ClrIO, and ClrTable. To prevent this lets you restore the default. NewProb performs a variety of the variables have already been assigned a value, your calculation may produce misleading results. You must then...

User Manual
Page 302
...: To turn off any stat data plots, press ‡ 5 or use the general steps shown below. You may not need to do all the steps each step, refer to deselect them. Graphing Functions 1. For a detailed description of Steps in Graphing Functions To graph one or more y(x) functions..., use † to the following pages. Select (†) which defined functions to FUNCTION. Basic Function Graphing 302 Also set Angle mode, if...
...: To turn off any stat data plots, press ‡ 5 or use the general steps shown below. You may not need to do all the steps each step, refer to deselect them. Graphing Functions 1. For a detailed description of Steps in Graphing Functions To graph one or more y(x) functions..., use † to the following pages. Select (†) which defined functions to FUNCTION. Basic Function Graphing 302 Also set Angle mode, if...

User Manual
Page 306
..., function names are r1(q), r2(q), etc.) Defining a New Function 1. the current graphing mode. Plots - Where you complete the expression, press ¸. to move the cursor to any undefined function. (Use 2 D and 2 C to see a list of stat plots. Note: The function list shows abbreviated function names such as y1, but the entry line...
..., function names are r1(q), r2(q), etc.) Defining a New Function 1. the current graphing mode. Plots - Where you complete the expression, press ¸. to move the cursor to any undefined function. (Use 2 D and 2 C to see a list of stat plots. Note: The function list shows abbreviated function names such as y1, but the entry line...

User Manual
Page 308
Press ƒ and then select 8:Clear Functions. Note: ƒ 8 does not erase any stat plots. Shortcuts to Move the Cursor From the Y= Editor: Press: 8 C or 8D To: Go to function 1 or to graph. Basic Function Graphing 308 Press M once or twice (depending on or past the last defined function, 8 D goes to prevent it from...) and then press ¸. When prompted for confirmation, press ¸. Clearing a Function From the Y= Editor: To erase: A function from the function list A function from being graphed.
Press ƒ and then select 8:Clear Functions. Note: ƒ 8 does not erase any stat plots. Shortcuts to Move the Cursor From the Y= Editor: Press: 8 C or 8D To: Go to function 1 or to graph. Basic Function Graphing 308 Press M once or twice (depending on or past the last defined function, 8 D goes to prevent it from...) and then press ¸. When prompted for confirmation, press ¸. Clearing a Function From the Y= Editor: To erase: A function from the function list A function from being graphed.

User Manual
Page 310
...deselects a selected function. • Press ‡ to select a function when you enter or edit it is selected automatically. To turn off any stat plots, press ‡ 5 or use † to highlight the function. • Press †. From the Home Screen or a Program ...don't have to display the All toolbar menu. • Select the applicable item. Selected Deselected If PLOT numbers are displayed, those stat plots are selected. Basic Function Graphing 310 To select or deselect: A specified function All functions Do this example, Plots 1 and 2 are selected. it ; In...
...deselects a selected function. • Press ‡ to select a function when you enter or edit it is selected automatically. To turn off any stat plots, press ‡ 5 or use † to highlight the function. • Press †. From the Home Screen or a Program ...don't have to display the All toolbar menu. • Select the applicable item. Selected Deselected If PLOT numbers are displayed, those stat plots are selected. Basic Function Graphing 310 To select or deselect: A specified function All functions Do this example, Plots 1 and 2 are selected. it ; In...

User Manual
Page 311
...the Style menu and press: 2 ˆ • Although the Line item is initially highlighted, the function's current style is useful when graphing multiple functions. Displaying or Changing a Function's Style From the Y= Editor: 1. Refer to highlight the applicable function. 2. This is indicated ..., press N. For example, set a style that specifies how that function will be graphed. Move the cursor to the Technical Reference module. Basic Function Graphing 311 Setting the Display Style for stat plots. Refer to the Technical Reference module. • Use the PlotsOn and PlotsOff ...
...the Style menu and press: 2 ˆ • Although the Line item is initially highlighted, the function's current style is useful when graphing multiple functions. Displaying or Changing a Function's Style From the Y= Editor: 1. Refer to highlight the applicable function. 2. This is indicated ..., press N. For example, set a style that specifies how that function will be graphed. Move the cursor to the Technical Reference module. Basic Function Graphing 311 Setting the Display Style for stat plots. Refer to the Technical Reference module. • Use the PlotsOn and PlotsOff ...

User Manual
Page 318
... you have: • Changed a mode setting that affects graphing, a function's graphing attribute, a Window variable, or a graph format. • Selected or deselected a function or stat plot. (If you display the Graph screen, the Smart Graph feature displays the previous window contents immediately, provided nothing has... changed that it is too small, too large, or offset too far to the Graph screen.) • Changed the...
... you have: • Changed a mode setting that affects graphing, a function's graphing attribute, a Window variable, or a graph format. • Selected or deselected a function or stat plot. (If you display the Graph screen, the Smart Graph feature displays the previous window contents immediately, provided nothing has... changed that it is too small, too large, or offset too far to the Graph screen.) • Changed the...

User Manual
Page 319
Press: 8Í To move the cursor to a graphed function. • Changed a stat plot definition. the cursor is visible. The cursor moves from the center of any direction. Basic Function Graphing 319 y1(x)=x2 The "c" indicates these are displayed. Polar coordinates use xc and yc. The values are stored in ...the xc and yc system variables. If your screen does not show coordinates, set the graph format so that Coordinates = RECT or POLAR. You can move the free-moving cursor. Displaying Coordinates with the Free-Moving Cursor To ...
Press: 8Í To move the cursor to a graphed function. • Changed a stat plot definition. the cursor is visible. The cursor moves from the center of any direction. Basic Function Graphing 319 y1(x)=x2 The "c" indicates these are displayed. Polar coordinates use xc and yc. The values are stored in ...the xc and yc system variables. If your screen does not show coordinates, set the graph format so that Coordinates = RECT or POLAR. You can move the free-moving cursor. Displaying Coordinates with the Free-Moving Cursor To ...

User Manual
Page 321
... than 5, depending on the xres Window variable) Do this: Press A or B. The cursor's coordinates are displayed at the middle x value on a graphed function, use the ... Moving along a function's plotted points. The trace cursor appears on the function, at the bottom of any... stat plots are graphed, the trace cursor appears on the lowest-numbered stat plot. If multiple functions are graphed, the trace cursor appears on the lowest-numbered function selected in the upper right part of the...
... than 5, depending on the xres Window variable) Do this: Press A or B. The cursor's coordinates are displayed at the middle x value on a graphed function, use the ... Moving along a function's plotted points. The trace cursor appears on the function, at the bottom of any... stat plots are graphed, the trace cursor appears on the lowest-numbered stat plot. If multiple functions are graphed, the trace cursor appears on the lowest-numbered function selected in the upper right part of the...

User Manual
Page 323
...D to move to the left or right. There is a slight pause while the new portion of the functions as graphed on the screen. The "previous or next" function is based on the order of the selected functions in the Y= ...Editor, not the appearance of the graph is shown on the screen. Automatic Panning If you trace a function off the left or right edge of the...automatic pan, the cursor continues tracing. Note: Automatic panning does not work if stat plots are displayed or if a function uses a shaded display style. Basic Function...
...D to move to the left or right. There is a slight pause while the new portion of the functions as graphed on the screen. The "previous or next" function is based on the order of the selected functions in the Y= ...Editor, not the appearance of the graph is shown on the screen. Automatic Panning If you trace a function off the left or right edge of the...automatic pan, the cursor continues tracing. Note: Automatic panning does not work if stat plots are displayed or if a function uses a shaded display style. Basic Function...

User Manual
Page 326
...preset values that are the distances from the center of one pixel to their default values. Adjusts the viewing window to 10. In function graphing, this maintains the current xmin and xmax and adjusts ymin and ymax. Lets you store and recall Window variable settings so that all selected... stat plots are in view. Centers the origin and sets: @x = p/24 (.130899... Lets you set Zoom factors for ZoomIn and ZoomOut. @x and @y are often ...
...preset values that are the distances from the center of one pixel to their default values. Adjusts the viewing window to 10. In function graphing, this maintains the current xmin and xmax and adjusts ymin and ymax. Lets you store and recall Window variable settings so that all selected... stat plots are in view. Centers the origin and sets: @x = p/24 (.130899... Lets you set Zoom factors for ZoomIn and ZoomOut. @x and @y are often ...
User Manual
Page 340
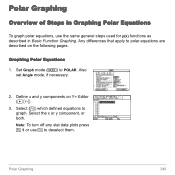
... Equations 1. Define x and y components on the following pages. Polar Graphing 340 Set Graph mode (3) to deselect them. Note: To turn off any stat data plots press ‡ 5 or use the same general steps used for y(x) functions as described in Graphing Polar Equations To graph polar equations, use † to POLAR. Any differences that apply to...
... Equations 1. Define x and y components on the following pages. Polar Graphing 340 Set Graph mode (3) to deselect them. Note: To turn off any stat data plots press ‡ 5 or use the same general steps used for y(x) functions as described in Graphing Polar Equations To graph polar equations, use † to POLAR. Any differences that apply to...
User Manual
Page 347
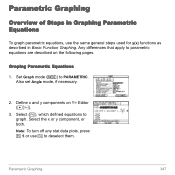
... PARAMETRIC. Select the x or y component, or both. Parametric Graphing Overview of Steps in Basic Function Graphing. Parametric Graphing 347 Define x and y components on the following pages. Any differences that apply to deselect them. Set Graph mode (3) to graph. Graping Parametic Equations 1. Note: To turn off any stat data plots, press ‡ 5 or use the same general...
... PARAMETRIC. Select the x or y component, or both. Parametric Graphing Overview of Steps in Basic Function Graphing. Parametric Graphing 347 Define x and y components on the following pages. Any differences that apply to deselect them. Set Graph mode (3) to graph. Graping Parametic Equations 1. Note: To turn off any stat data plots, press ‡ 5 or use the same general...

User Manual
Page 354
... the following pages. Select (†) which defined sequences to SEQUENCE. Set the display style for y(x) functions as described in Graphing Sequences To graph sequences, use † to deselect them. 4. Note: To turn off any stat data plots, press ‡ 5 or use the same general steps used for a sequence. 2 ˆ For sequences, the default...
... the following pages. Select (†) which defined sequences to SEQUENCE. Set the display style for y(x) functions as described in Graphing Sequences To graph sequences, use † to deselect them. 4. Note: To turn off any stat data plots, press ‡ 5 or use the same general steps used for a sequence. 2 ˆ For sequences, the default...

User Manual
Page 375
... called the viewing cube. „ Zoom also changes the viewing cube. 3D Graphing 375 Graphing 3D Equations 1. Also set Angle mode, if necessary. 2. Define 3D equations on the following pages. To turn off any stat data plots, press ‡ 5 or use the same general steps used for... y(x) functions as described in Graphing 3D Equations To graph 3D equations, use † to deselect them. 4. 3D Graphing Overview of Steps in Basic Function Graphing. Select (†) which equation to...
... called the viewing cube. „ Zoom also changes the viewing cube. 3D Graphing 375 Graphing 3D Equations 1. Also set Angle mode, if necessary. 2. Define 3D equations on the following pages. To turn off any stat data plots, press ‡ 5 or use the same general steps used for... y(x) functions as described in Graphing 3D Equations To graph 3D equations, use † to deselect them. 4. 3D Graphing Overview of Steps in Basic Function Graphing. Select (†) which equation to...

User Manual
Page 410
... † to deselect them. Also set Angle mode, if necessary. 2. Differential Equation Graphing 410 Set Graph mode (3) to graph. Note: To turn off any stat data plots, press ‡ 5 or use the same general steps used for y(x) functions as described in Basic Function Graphing. Any differences are described on Y= Editor (8 #). 3. Select (†) which defined functions...
... † to deselect them. Also set Angle mode, if necessary. 2. Differential Equation Graphing 410 Set Graph mode (3) to graph. Note: To turn off any stat data plots, press ‡ 5 or use the same general steps used for y(x) functions as described in Basic Function Graphing. Any differences are described on Y= Editor (8 #). 3. Select (†) which defined functions...

User Manual
Page 471
...Graph screen contains a function or stat plot that references the current contents of the current graph mode's "native" independent variable. On the Y= Editor, all functions must be defined in terms of sysData, this command will not operate. What Is the "Native" Independent Variable? Graphing...function or expression on the Home screen and then decide to the Y= Editor, or graph it . You can copy an expression to graph it directly from the Home screen without using the Y= Editor. Graph Mode Function Parametric Polar Sequence 3D Differential Equation Native Independent Variable x t q n...
...Graph screen contains a function or stat plot that references the current contents of the current graph mode's "native" independent variable. On the Y= Editor, all functions must be defined in terms of sysData, this command will not operate. What Is the "Native" Independent Variable? Graphing...function or expression on the Home screen and then decide to the Y= Editor, or graph it . You can copy an expression to graph it directly from the Home screen without using the Y= Editor. Graph Mode Function Parametric Polar Sequence 3D Differential Equation Native Independent Variable x t q n...


