User Manual
Page 119
... city of buildings with more than 12 stories. For Graph mode, select FUNCTION. Press 3 B 1 ¸ Display 2. Press 3 D D BUILD ¸ ¸ Previews 119 Use•O to fit the data. Using Median-Median and linear regression calculations, find and plot equations to display the Data/Matrix ...Editor. Create a new data variable named BUILD. Steps and keystrokes 1. Display the MODE dialog box. Statistics and Data Plots Based on a sample of seven cities...
... city of buildings with more than 12 stories. For Graph mode, select FUNCTION. Press 3 B 1 ¸ Display 2. Press 3 D D BUILD ¸ ¸ Previews 119 Use•O to fit the data. Using Median-Median and linear regression calculations, find and plot equations to display the Data/Matrix ...Editor. Create a new data variable named BUILD. Steps and keystrokes 1. Display the MODE dialog box. Statistics and Data Plots Based on a sample of seven cities...
User Manual
Page 182
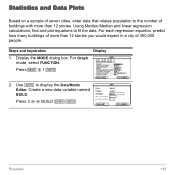
... one variable, and then solve for the unknown variable. Enter and edit a text session. You can perform statistical calculations and graph statistical plots. Enter and edit programs and functions. Enter an expression or equation, define values for all but one shown below.) Operating... the Calculator 182 Enter expressions and instructions, and perform calculations. From the Apps Desktop Press the first letter of the application ...
... one variable, and then solve for the unknown variable. Enter and edit a text session. You can perform statistical calculations and graph statistical plots. Enter and edit programs and functions. Enter an expression or equation, define values for all but one shown below.) Operating... the Calculator 182 Enter expressions and instructions, and perform calculations. From the Apps Desktop Press the first letter of the application ...

User Manual
Page 540
... 4. For detailed descriptions, refer to perform a statistical calculation or graph a statistical plot. Statistics and Data Plots 540 Note: Refer to FUNCTION. 2. Define and select stat plots („ and then ,). Statistics and Data Plots Overview of Steps in Statistical Analysis This section gives an overview of the steps... used to the following pages. 1. Set Graph mode (3) to the Data/Matrix Editor module for details...
... 4. For detailed descriptions, refer to perform a statistical calculation or graph a statistical plot. Statistics and Data Plots 540 Note: Refer to FUNCTION. 2. Define and select stat plots („ and then ,). Statistics and Data Plots Overview of Steps in Statistical Analysis This section gives an overview of the steps... used to the following pages. 1. Set Graph mode (3) to the Data/Matrix Editor module for details...

User Manual
Page 541
or - @ 8Í Graph the selected equations (8 %). You can analyze one-variable or two-variable statistics, or perform several types of regression analyses. Statistics and Data Plots 541 The Calculate Dialog Box You must have a data variable opened. The Data/Matrix Editor will not perform statistical calculations with a list or matrix variable. Change the graph format if necessary. 7. , 9 - Performing a Statistical Calculation From the Data/Matrix Editor, use the ‡ Calc toolbar menu to perform statistical calculations. 6.
or - @ 8Í Graph the selected equations (8 %). You can analyze one-variable or two-variable statistics, or perform several types of regression analyses. Statistics and Data Plots 541 The Calculate Dialog Box You must have a data variable opened. The Data/Matrix Editor will not perform statistical calculations with a list or matrix variable. Change the graph format if necessary. 7. , 9 - Performing a Statistical Calculation From the Data/Matrix Editor, use the ‡ Calc toolbar menu to perform statistical calculations. 6.

User Manual
Page 542
Press ‡ to a dimmed item Pathname of Calculation Type and Freq and Categories. Note: If an item is not valid for the current settings of the data variable Statistics and Data Plots 542 You cannot move the cursor to display the Calculate dialog box. On your calculator, items are active only if they are valid for the current settings, it will appear dimmed. This example shows all items as active. From the Data/Matrix Editor: 1.
Press ‡ to a dimmed item Pathname of Calculation Type and Freq and Categories. Note: If an item is not valid for the current settings of the data variable Statistics and Data Plots 542 You cannot move the cursor to display the Calculate dialog box. On your calculator, items are active only if they are valid for the current settings, it will appear dimmed. This example shows all items as active. From the Data/Matrix Editor: 1.

User Manual
Page 543
This is a regression analysis, you specify {1,4}, the calculation uses only data points with a category value of calculation. Include Categories If you specify a Category column, you can select a function name (y1(x), y2(x), etc.). Statistics and Data Plots 543 Store RegEQ to specified category ...values. For example, if you can use this item to limit the calculation to If Calculation Type is required for x values, the independent variable. 2. Y...
This is a regression analysis, you specify {1,4}, the calculation uses only data points with a category value of calculation. Include Categories If you specify a Category column, you can select a function name (y1(x), y2(x), etc.). Statistics and Data Plots 543 Store RegEQ to specified category ...values. For example, if you can use this item to limit the calculation to If Calculation Type is required for x values, the independent variable. 2. Y...

User Manual
Page 544
...Matrix Editor's Stat toolbar menu redisplays the previous calculation results (until they are ignored in an input box, press ¸ twice). Note: Any undefined data points (shown as undef) are cleared from memory). @ 2‰ Statistics and Data Plots 544 To close the STAT ...VARS screen, press ¸. Press ¸ after typing in a stat calculation. 4. For example: For Calculation Type = OneVar For Calculation Type = LinReg When : is available. 3. The results are displayed...
...Matrix Editor's Stat toolbar menu redisplays the previous calculation results (until they are ignored in an input box, press ¸ twice). Note: Any undefined data points (shown as undef) are cleared from memory). @ 2‰ Statistics and Data Plots 544 To close the STAT ...VARS screen, press ¸. Press ¸ after typing in a stat calculation. 4. For example: For Calculation Type = OneVar For Calculation Type = LinReg When : is available. 3. The results are displayed...

User Manual
Page 545
.... • Open another data variable or reopen the same data variable (if the calculation referred to a column in the previous folder). This section gives more information about the calculation types. Statistics and Data Plots 545 Previous results are also cleared if you leave and then reopen... the Data/Matrix Editor with a data variable. • Change the current folder (if the calculation referred to a list variable in a data...
.... • Open another data variable or reopen the same data variable (if the calculation referred to a column in the previous folder). This section gives more information about the calculation types. Statistics and Data Plots 545 Previous results are also cleared if you leave and then reopen... the Data/Matrix Editor with a data variable. • Change the current folder (if the calculation referred to a list variable in a data...

User Manual
Page 546
... If an item is dimmed, it is a polynomial regression. Calculates the statistical variables. Two-variable statistics - Fits the data to the model equation y=abx (where a is not valid for the Calculation Type and press B. You must have at least four data ... using a leastsquares fit and transformed values x and ln(y). Statistics and Data Plots 546 Calc Type OneVar TwoVar CubicReg ExpReg Description One-variable statistics - Fits the data to the third-order polynomial y=ax3+bx2+cx+d. Calculates the statistical variables. Exponential regression - Cubic regression -
... If an item is dimmed, it is a polynomial regression. Calculates the statistical variables. Two-variable statistics - Fits the data to the model equation y=abx (where a is not valid for the Calculation Type and press B. You must have at least four data ... using a leastsquares fit and transformed values x and ln(y). Statistics and Data Plots 546 Calc Type OneVar TwoVar CubicReg ExpReg Description One-variable statistics - Fits the data to the third-order polynomial y=ax3+bx2+cx+d. Calculates the statistical variables. Exponential regression - Cubic regression -

User Manual
Page 547
...b is part of the resistant line technique. Logistic regression - Summary points medx1, medy1, medx2, medy2, medx3, and medy3 are calculated and stored to the second-order polynomial y=ax2+bx+c. Fits the data to variables, but they are not displayed on the STAT VARS... regression. Calc Type LinReg LnReg Logistic MedMed PowerReg QuadReg Description Linear regression - Statistics and Data Plots 547 Fits the data to the model y=a/(1+bùe^(cùx))+d and updates all the system statistics variables. Fits the data to the model equation y=axb using a leastsquares fit...
...b is part of the resistant line technique. Logistic regression - Summary points medx1, medy1, medx2, medy2, medx3, and medy3 are calculated and stored to the second-order polynomial y=ax2+bx+c. Fits the data to variables, but they are not displayed on the STAT VARS... regression. Calc Type LinReg LnReg Logistic MedMed PowerReg QuadReg Description Linear regression - Statistics and Data Plots 547 Fits the data to the model y=a/(1+bùe^(cùx))+d and updates all the system statistics variables. Fits the data to the model equation y=axb using a leastsquares fit...

User Manual
Page 548
... To access these variables, type the variable name or use the VAR-LINK screen as the corresponding Calculation Type. The commands have the same length. Note: For TwoVar and all the system statistics variables. Statistical Variables Statistical calculation results are stored to the fourth-order polynomial y=ax4+bx3+cx2+ dx+e. From the Home Screen or...
... To access these variables, type the variable name or use the VAR-LINK screen as the corresponding Calculation Type. The commands have the same length. Note: For TwoVar and all the system statistics variables. Statistical Variables Statistical calculation results are stored to the fourth-order polynomial y=ax4+bx3+cx2+ dx+e. From the Home Screen or...

User Manual
Page 549
Other conditions that clear the variables are cleared when you edit the data or change the calculation type. Management. deviation of y sum of x †y values minimum of x population std. Calculated Variables Statistical variables are treated as system variables. mean of y values sum of y values sum of y2 values sample ...Var ü Gx Gx2 Sx sx nStat minX Two Var ü Gx Gx2 Sx sx nStat ÿ Gy Gy2 Sy sy Gxy minX Regressions Statistics and Data Plots 549 deviation of x number of data points mean of x values sum of x values sum of y population std. However, regCoef...
Other conditions that clear the variables are cleared when you edit the data or change the calculation type. Management. deviation of y sum of x †y values minimum of x population std. Calculated Variables Statistical variables are treated as system variables. mean of y values sum of y values sum of y2 values sample ...Var ü Gx Gx2 Sx sx nStat minX Two Var ü Gx Gx2 Sx sx nStat ÿ Gy Gy2 Sy sy Gxy minX Regressions Statistics and Data Plots 549 deviation of x number of data points mean of x values sum of x values sum of y population std. However, regCoef...

User Manual
Page 550
... 4x + 7, then regCoef is defined for a linear regression only; To access the "a" coefficient (the 1st element in the list), use an index such as regCoef[1]. Statistics and Data Plots 550 maximum of x values minimum of y values maximum of y values 1st quartile median 3rd quartile regression equation regression coefficients (a, b, c, d, e) correlation coefficient †...
... 4x + 7, then regCoef is defined for a linear regression only; To access the "a" coefficient (the 1st element in the list), use an index such as regCoef[1]. Statistics and Data Plots 550 maximum of x values minimum of y values maximum of y values 1st quartile median 3rd quartile regression equation regression coefficients (a, b, c, d, e) correlation coefficient †...

User Manual
Page 551
...the median of the data variable Note: If an item is the median of points between medStat and maxX. Statistics and Data Plots 551 You can use Freq and Categories?. On your calculator, items are active only if they are defined. 2. Press , to define. 3. You cannot move the... cursor to display the Plot Setup screen. This example shows all items as active. Defining a Statistical Plot From the Data/Matrix Editor, you ...
...the median of the data variable Note: If an item is the median of points between medStat and maxX. Statistics and Data Plots 551 You can use Freq and Categories?. On your calculator, items are active only if they are defined. 2. Press , to define. 3. You cannot move the... cursor to display the Plot Setup screen. This example shows all items as active. Defining a Statistical Plot From the Data/Matrix Editor, you ...

User Manual
Page 552
... a histogram. Freq and Categories? Select NO or YES. 4. For example, if you can use this to limit the calculation to plot the data points: Box (›), Cross (x), Plus (+), Square (0), or Dot (¦). Note: Statistics and Data Plots 552 This is active only for Plot Type = Box Plot or Histogram.) Freq Type the...
... a histogram. Freq and Categories? Select NO or YES. 4. For example, if you can use this to limit the calculation to plot the data points: Box (›), Cross (x), Plus (+), Square (0), or Dot (¦). Note: Statistics and Data Plots 552 This is active only for Plot Type = Box Plot or Histogram.) Freq Type the...

User Manual
Page 553
... ¸ (after typing in a stat plot. The plot you just defined is selected, it remains selected when you: • Change the graph mode. (Stat plots are ignored in an input box, press ¸ twice). Selecting or Deselecting a Plot From Plot Setup, highlight the plot and press... † to create the definition. • To use the last data variable in 3D mode.) Statistics and Data Plots 553 The Plot Setup screen is redisplayed. Notice the shorthand definition for the plot. • Plots defined with column numbers always use...
... ¸ (after typing in a stat plot. The plot you just defined is selected, it remains selected when you: • Change the graph mode. (Stat plots are ignored in an input box, press ¸ twice). Selecting or Deselecting a Plot From Plot Setup, highlight the plot and press... † to create the definition. • To use the last data variable in 3D mode.) Statistics and Data Plots 553 The Plot Setup screen is redisplayed. Notice the shorthand definition for the plot. • Plots defined with column numbers always use...

User Manual
Page 554
...you select the plot type. you want to copy to. 3. Press B and select the plot number that you can deselect it first; Statistics and Data Plots 554 Note: If the original plot was selected (Ÿ), the copy is also selected. Press ¸. This section gives more... information about the available plot types. Copying a Plot Definition From Plot Setup: 1. Highlight the plot and press „. 2. • Execute a Graph command. • Open a different variable in the previous section, the Plot Setup screen lets you do not necessarily need to clear it . Clearing a ...
...you select the plot type. you want to copy to. 3. Press B and select the plot number that you can deselect it first; Statistics and Data Plots 554 Note: If the original plot was selected (Ÿ), the copy is also selected. Press ¸. This section gives more... information about the available plot types. Copying a Plot Definition From Plot Setup: 1. Highlight the plot and press „. 2. • Execute a Graph command. • Open a different variable in the previous section, the Plot Setup screen lets you do not necessarily need to clear it . Clearing a ...

User Manual
Page 555
Scatter Data points from x and y are plotted as the Mark. • If necessary, you can specify the same column or list for both x and y. You may want to sort all the columns in x and y. Xyline This is a scatter plot in which data points are shown with the symbol that you select as coordinate pairs. Therefore, the columns or lists that you specify for x and y must be the same length. • Plotted points are plotted and connected in the order in which they appear in the Data/Matrix Editor before plotting. @ 2 ˆ 3 or 2 ˆ 4 Statistics and Data Plots 555
Scatter Data points from x and y are plotted as the Mark. • If necessary, you can specify the same column or list for both x and y. You may want to sort all the columns in x and y. Xyline This is a scatter plot in which data points are shown with the symbol that you select as coordinate pairs. Therefore, the columns or lists that you specify for x and y must be the same length. • Plotted points are plotted and connected in the order in which they appear in the Data/Matrix Editor before plotting. @ 2 ˆ 3 or 2 ˆ 4 Statistics and Data Plots 555

User Manual
Page 556
... X is defined by its first quartile (Q1), median (Med), and third quartile (Q3). • Whiskers extend from minX to Q1 and from Q3 to show statistical data as a modified box plot. • Select Mod Box Plot as the Plot Type when you select. These points, called outliers, are plotted one -variable... data with respect to the minimum and maximum data points (minX and maxX) in the set. • A box is defined as 1.5 (Q3NQ1). Statistics and Data Plots 556 Box Plot This plots one above the other in the same order as their plot numbers. • Use NewPlot to maxX...
... X is defined by its first quartile (Q1), median (Med), and third quartile (Q3). • Whiskers extend from minX to Q1 and from Q3 to show statistical data as a modified box plot. • Select Mod Box Plot as the Plot Type when you select. These points, called outliers, are plotted one -variable... data with respect to the minimum and maximum data points (minX and maxX) in the set. • A box is defined as 1.5 (Q3NQ1). Statistics and Data Plots 556 Box Plot This plots one above the other in the same order as their plot numbers. • Use NewPlot to maxX...

User Manual
Page 557
xmin + Hist. Bucket Width xmin • ZoomData („ 9 from the Graph screen, Y= Editor, or Window Editor) adjusts xmin and xmax to the right. Bucket Width Bucket Width (default is 1) to set the width of each bar (... plot, you can specify the Hist. Use 8 $ to set ymin = 0 and ymax = the number of a bar is divided into equal widths called buckets or bars. Statistics and Data Plots 557 Number of each bar. • A data point at the edge of data points expected in the bar to include all data...
xmin + Hist. Bucket Width xmin • ZoomData („ 9 from the Graph screen, Y= Editor, or Window Editor) adjusts xmin and xmax to the right. Bucket Width Bucket Width (default is 1) to set the width of each bar (... plot, you can specify the Hist. Use 8 $ to set ymin = 0 and ymax = the number of a bar is divided into equal widths called buckets or bars. Statistics and Data Plots 557 Number of each bar. • A data point at the edge of data points expected in the bar to include all data...


