
User Manual
Page 28
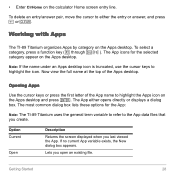
The App icons for the App: Note: The TI-89 Titanium uses the general term variable to refer to either opens directly or displays a dialog box. The App either the entry or answer, and press 0 ... truncated, use the cursor keys to highlight the Apps icon on the calculator Home screen entry line. The most common dialog box lists these options for the selected category appear on the Apps desktop. Getting Started 28 Working with Apps The TI-89 Titanium organizes Apps by category on the Apps desktop. To delete...
The App icons for the App: Note: The TI-89 Titanium uses the general term variable to refer to either opens directly or displays a dialog box. The App either the entry or answer, and press 0 ... truncated, use the cursor keys to highlight the Apps icon on the calculator Home screen entry line. The most common dialog box lists these options for the selected category appear on the Apps desktop. Getting Started 28 Working with Apps The TI-89 Titanium organizes Apps by category on the Apps desktop. To delete...

User Manual
Page 62
... App and press ¸. 3. Repeat steps 1 and 2 for each split-screen portion: 1. To set up and display two independent graphs. Press DB Result Getting Started 62 Works together with Split 1 App, which lets you specify the App displayed in the top or left portion of available Apps. (See "Setting... split-screen mode" on page 59.) 2. Mode Split 2 App Number of Graphs Description Lets you set the initial App for the...
... App and press ¸. 3. Repeat steps 1 and 2 for each split-screen portion: 1. To set up and display two independent graphs. Press DB Result Getting Started 62 Works together with Split 1 App, which lets you specify the App displayed in the top or left portion of available Apps. (See "Setting... split-screen mode" on page 59.) 2. Mode Split 2 App Number of Graphs Description Lets you set the initial App for the...

User Manual
Page 253
... is valid and the expression is not always valid, the logarithms are valid for more general expressions (either møc2=e or c2øm=e) may not work as you anticipate.
... is valid and the expression is not always valid, the logarithms are valid for more general expressions (either møc2=e or c2øm=e) may not work as you anticipate.

User Manual
Page 323
... shown on the screen. Automatic Panning If you trace a function off the left or right edge of the functions as graphed on the screen. The "previous or next" function is based on the order of the selected functions in the Y= Editor, not the appearance of the ... automatically pans to the previous or next selected function at the same x value. Note: Automatic panning does not work if stat plots are displayed or if a function uses a shaded display style. Basic Function Graphing 323 Moving from Function to Function Press C or D to move to the left or right. The new function...
... shown on the screen. Automatic Panning If you trace a function off the left or right edge of the functions as graphed on the screen. The "previous or next" function is based on the order of the selected functions in the Y= Editor, not the appearance of the ... automatically pans to the previous or next selected function at the same x value. Note: Automatic panning does not work if stat plots are displayed or if a function uses a shaded display style. Basic Function Graphing 323 Moving from Function to Function Press C or D to move to the left or right. The new function...

User Manual
Page 345
... variables (qmin, qmax, qstep) are shown in function graphing, you trace a polar equation, the q coordinate is shown even if Coordinates = RECT. If Coordinates = RECT, the polar equations will be graphed properly, but coordinates will be displayed as it does for function graphs. Tool Free-Moving Cursor „ Zoom For Polar Graphs: Works just as x and y.
... variables (qmin, qmax, qstep) are shown in function graphing, you trace a polar equation, the q coordinate is shown even if Coordinates = RECT. If Coordinates = RECT, the polar equations will be graphed properly, but coordinates will be displayed as it does for function graphs. Tool Free-Moving Cursor „ Zoom For Polar Graphs: Works just as x and y.

User Manual
Page 352
... = L10. You may need to change the standard values for function graphs. Note: During a trace, you can explore a graph by typing the t value and pressing ¸. Parametric Graphing 352 xscl = 1. Exploring a Graph As in function graphing, you can use QuickCenter at any time during a trace, even if...ymax = 10. Standard values (set when you select 6:ZoomStd from the „ Zoom toolbar menu) are plotted. Tool Free-Moving Cursor For Parametric Graphs: Works just as it does for the t variables (tmin, tmax, tstep) to ensure that enough points are : tmin = 0 tmax = 2p tstep ...
... = L10. You may need to change the standard values for function graphs. Note: During a trace, you can explore a graph by typing the t value and pressing ¸. Parametric Graphing 352 xscl = 1. Exploring a Graph As in function graphing, you can use QuickCenter at any time during a trace, even if...ymax = 10. Standard values (set when you select 6:ZoomStd from the „ Zoom toolbar menu) are plotted. Tool Free-Moving Cursor For Parametric Graphs: Works just as it does for the t variables (tmin, tmax, tstep) to ensure that enough points are : tmin = 0 tmax = 2p tstep ...
User Manual
Page 353
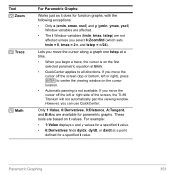
... the screen (top or bottom, left or right side of the screen, the TI-89 Titanium will not automatically pan the viewing window. Parametric Graphing 353 Tool „ Zoom ... If you move the cursor along a graph one tstep at a time. • When you select 6:ZoomStd (which sets tmin...Value, 6:Derivatives, 9:Distance, A:Tangent, and B:Arc are based on the first selected parametric equation at a point defined for parametric graphs. Trace ‡ Math For Parametric Graphs: Works just as it does for a specified t value. • 6:Derivatives finds dy/dx, dy/dt, or dx/dt at tmin...
... the screen (top or bottom, left or right side of the screen, the TI-89 Titanium will not automatically pan the viewing window. Parametric Graphing 353 Tool „ Zoom ... If you move the cursor along a graph one tstep at a time. • When you select 6:ZoomStd (which sets tmin...Value, 6:Derivatives, 9:Distance, A:Tangent, and B:Arc are based on the first selected parametric equation at a point defined for parametric graphs. Trace ‡ Math For Parametric Graphs: Works just as it does for a specified t value. • 6:Derivatives finds dy/dx, dy/dt, or dx/dt at tmin...

User Manual
Page 361
Tool Free-Moving Cursor For Sequence Graphs: Works just as it does for the sequence Changing the Graph Format The Graph Order format is not available. • With TIME or CUSTOM axes, multiple sequences are always plotted simultaneously. • With WEB axes,...following tools. Any displayed coordinates are always plotted sequentially. You could set: • xmin = first n value to view. Exploring a Graph As in the graph format. Sequence Graphing 361 Simply define a viewing window that shows only the area of the sequence. With TIME axes (from Axes on the Y= Editor), you...
Tool Free-Moving Cursor For Sequence Graphs: Works just as it does for the sequence Changing the Graph Format The Graph Order format is not available. • With TIME or CUSTOM axes, multiple sequences are always plotted simultaneously. • With WEB axes,...following tools. Any displayed coordinates are always plotted sequentially. You could set: • xmin = first n value to view. Exploring a Graph As in the graph format. Sequence Graphing 361 Simply define a viewing window that shows only the area of the sequence. With TIME axes (from Axes on the Y= Editor), you...

User Manual
Page 362
... you use TIME, CUSTOM, or WEB axes, Trace operates very differently. • With TIME or CUSTOM axes, you select 6:ZoomStd (which sets all directions. Sequence Graphing 362 Depending on the axes you move the cursor along the sequence one plotstep at a time, press 2 B or 2 A. - Tool „ Zoom ... When you begin... move the cursor off the screen (top or bottom, left or right), press ¸ to their standard values). Trace ‡ Math For Sequence Graphs: Works just as it is on the cursor location. • With WEB axes, the trace cursor follows the web, not the sequence.
... you use TIME, CUSTOM, or WEB axes, Trace operates very differently. • With TIME or CUSTOM axes, you select 6:ZoomStd (which sets all directions. Sequence Graphing 362 Depending on the axes you move the cursor along the sequence one plotstep at a time, press 2 B or 2 A. - Tool „ Zoom ... When you begin... move the cursor off the screen (top or bottom, left or right), press ¸ to their standard values). Trace ‡ Math For Sequence Graphs: Works just as it is on the cursor location. • With WEB axes, the trace cursor follows the web, not the sequence.
User Manual
Page 381
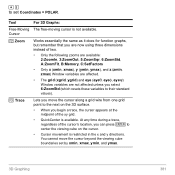
Works essentially the same as it does for function graphs, but remember that you are now using three dimensions instead of two. • Only the following zooms are available: 2:ZoomIn, 3:ZoomOut, 5:ZoomSqr, 6:ZoomStd, A:ZoomFit, B:Memory, C:... 6:ZoomStd (which resets these variables to their standard values). Lets you move the cursor beyond the viewing cube boundaries set Coordinates = POLAR. Tool For 3D Graphs: Free-Moving Cursor „ Zoom ... You cannot move the cursor along a grid wire from one grid point to the next on the cursor. • Cursor...
Works essentially the same as it does for function graphs, but remember that you are now using three dimensions instead of two. • Only the following zooms are available: 2:ZoomIn, 3:ZoomOut, 5:ZoomSqr, 6:ZoomStd, A:ZoomFit, B:Memory, C:... 6:ZoomStd (which resets these variables to their standard values). Lets you move the cursor beyond the viewing cube boundaries set Coordinates = POLAR. Tool For 3D Graphs: Free-Moving Cursor „ Zoom ... You cannot move the cursor along a grid wire from one grid point to the next on the cursor. • Cursor...

User Manual
Page 419
... Graphs: Works just as set when you select 6:ZoomStd from the „ Zoom toolbar menu) are plotted. tmax = 10. ymax = 10. dtime = 0. Any displayed coordinates are shown in rectangular or polar form as it does for the t variables to ensure that regraphs the plotted equations but does not affect the field, the TI-89...
... Graphs: Works just as set when you select 6:ZoomStd from the „ Zoom toolbar menu) are plotted. tmax = 10. ymax = 10. dtime = 0. Any displayed coordinates are shown in rectangular or polar form as it does for the t variables to ensure that regraphs the plotted equations but does not affect the field, the TI-89...

User Manual
Page 420
...tstep at a time, press 2 B or 2 A. Only 1:Value is available. • With TIME axes, the y(t) solution value (represented by typing a value for function graphs. • Only x (xmin, xmax, xscl) and y (ymin, ymax, yscl) Window variables are affected. • The t Window variables (t0, tmax, tstep, ... (which sets all plotted curves. Use C or D to select initial conditions interactively, you choose. Trace ‡ Math For Differential Equation Graphs: Works just as it does for t and pressing ¸. If you enter initial conditions in the Y= Editor or let the ncurves Window variable ...
...tstep at a time, press 2 B or 2 A. Only 1:Value is available. • With TIME axes, the y(t) solution value (represented by typing a value for function graphs. • Only x (xmin, xmax, xscl) and y (ymin, ymax, yscl) Window variables are affected. • The t Window variables (t0, tmax, tstep, ... (which sets all plotted curves. Use C or D to select initial conditions interactively, you choose. Trace ‡ Math For Differential Equation Graphs: Works just as it does for t and pressing ¸. If you enter initial conditions in the Y= Editor or let the ncurves Window variable ...

User Manual
Page 474
.... Graph does not work with sequence graphs or differential equations. Instead, it temporarily suspends any functions selected on the Table screen, just the same as shown in this example: A non-native independent variable Graph 1.25aùcos(a),a Specify the independent variable; In PARAMETRIC graphing mode: In POLAR graphing mode: In 3D graphing mode: Graph xExpr, yExpr, t Graph expr, q Graph expr...
.... Graph does not work with sequence graphs or differential equations. Instead, it temporarily suspends any functions selected on the Table screen, just the same as shown in this example: A non-native independent variable Graph 1.25aùcos(a),a Specify the independent variable; In PARAMETRIC graphing mode: In POLAR graphing mode: In 3D graphing mode: Graph xExpr, yExpr, t Graph expr, q Graph expr...

User Manual
Page 575
... Home screen. - all others are similar). The Program I/O screen is not the Home screen (although the two screens are dimmed. Note: If Home screen calculations don't work after you run a program, you need to recognize that it is used only to display output or to prompt the user for input. or - •... 575 Last output On the Program I/O screen: ‡ toolbar is no entry line. You can also execute Clr[O from the Home screen. You cannot perform calculations on the Program I/O screen.
... Home screen. - all others are similar). The Program I/O screen is not the Home screen (although the two screens are dimmed. Note: If Home screen calculations don't work after you run a program, you need to recognize that it is used only to display output or to prompt the user for input. or - •... 575 Last output On the Program I/O screen: ‡ toolbar is no entry line. You can also execute Clr[O from the Home screen. You cannot perform calculations on the Program I/O screen.
User Manual
Page 616
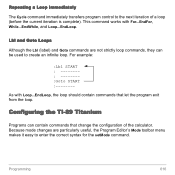
... the correct syntax for the setMode command. This command works with Loop...EndLoop, the loop should contain commands that change the configuration of a loop (before the current iteration is complete). Configuring the TI-89 Titanium Programs can be used to create an infinite loop.... For example: :Lbl START Goto START :-------- Programming 616 Repeating a Loop Immediately The Cycle command immediately transfers program control to the next iteration of the calculator.
... the correct syntax for the setMode command. This command works with Loop...EndLoop, the loop should contain commands that change the configuration of a loop (before the current iteration is complete). Configuring the TI-89 Titanium Programs can be used to create an infinite loop.... For example: :Lbl START Goto START :-------- Programming 616 Repeating a Loop Immediately The Cycle command immediately transfers program control to the next iteration of the calculator.
User Manual
Page 641
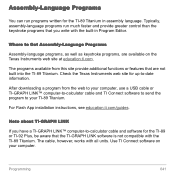
... Texas Instruments web site at education.ti.com. Check the Texas Instruments web site for the TI-89 Titanium in Program Editor. The cable, however, works with the TI-89 Titanium. Assembly-Language Programs You can run much faster and provide greater control than the keystroke programs that you have a TI-GRAPH LINK™ computer-to-calculator cable and software for the TI-89 or TI...
... Texas Instruments web site at education.ti.com. Check the Texas Instruments web site for the TI-89 Titanium in Program Editor. The cable, however, works with the TI-89 Titanium. Assembly-Language Programs You can run much faster and provide greater control than the keystroke programs that you have a TI-GRAPH LINK™ computer-to-calculator cable and software for the TI-89 or TI...
User Manual
Page 644
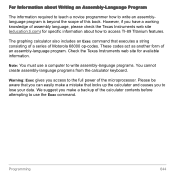
...working knowledge of the microprocessor. For Information about how to access TI-89 Titanium features. Check the Texas Instruments web site for specific information about Writing an Assembly-Language Program The information required to teach a novice programmer how to write an assemblylanguage program is beyond the scope of the calculator...write assembly-language programs. You cannot create assembly-language programs from the calculator keyboard. The graphing calculator also includes an Exec command that locks up the calculator and causes you make a backup of this book. Please be aware ...
...working knowledge of the microprocessor. For Information about how to access TI-89 Titanium features. Check the Texas Instruments web site for specific information about Writing an Assembly-Language Program The information required to teach a novice programmer how to write an assemblylanguage program is beyond the scope of the calculator...write assembly-language programs. You cannot create assembly-language programs from the calculator keyboard. The graphing calculator also includes an Exec command that locks up the calculator and causes you make a backup of this book. Please be aware ...
User Manual
Page 761
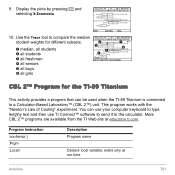
... for the TI-89 Titanium This activity provides a program that can use your computer keyboard to type lengthy text and then use TI Connect™ software to send it to a Calculator-Based Laboratory™ (CBL 2™) unit. Activities 761 Program Instruction :cooltemp( ) :Prgm :Local i Description Program name Declare local variable; This program works with the...
... for the TI-89 Titanium This activity provides a program that can use your computer keyboard to type lengthy text and then use TI Connect™ software to send it to a Calculator-Based Laboratory™ (CBL 2™) unit. Activities 761 Program Instruction :cooltemp( ) :Prgm :Local i Description Program name Declare local variable; This program works with the...
User Manual
Page 871
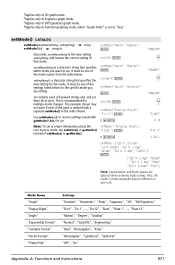
...("Display Digits", "Float") ¸ p ¥¸ "RADIAN" ‡2 2 "DEGREE" ‡2 2 "RADIAN" ‡2 2 "FLOAT" 3.14 "FIX 2" 3.141... Mode Name "Graph" "Display Digits" "Angle" "Exponential Format" "Complex Format" "Vector Format" "Pretty Print" Settings "Function", "Parametric", "Polar", "Sequence", "3D", "Diff Equations" "Fix 0", "Fix 1", ...","Degree") ¸ Sets mode modeNameString to restore settings saved with a separate setMode() in these examples may not work if each of that specifies the new setting for multiple-mode changes. The example shown may be one of keyword...
...("Display Digits", "Float") ¸ p ¥¸ "RADIAN" ‡2 2 "DEGREE" ‡2 2 "RADIAN" ‡2 2 "FLOAT" 3.14 "FIX 2" 3.141... Mode Name "Graph" "Display Digits" "Angle" "Exponential Format" "Complex Format" "Vector Format" "Pretty Print" Settings "Function", "Parametric", "Polar", "Sequence", "3D", "Diff Equations" "Fix 0", "Fix 1", ...","Degree") ¸ Sets mode modeNameString to restore settings saved with a separate setMode() in these examples may not work if each of that specifies the new setting for multiple-mode changes. The example shown may be one of keyword...

User Manual
Page 950
The BATT indicator is displayed. Press N to the entry line. - or - The PAUSE indicator is displayed. A graph or program is paused and the TI-89 Titanium / Voyage 200 is displayed. The BUSY indicator is waiting for input; Press N several times to exit any menu ... see anything on the display. Suggested action: Press ¥ « to darken or ¥ | to be working properly. Refer to the list of Difficulty If you have difficulty operating the TI-89 Titanium / Voyage™ 200, the following suggestions may help you want to stop the calculation, press ´.
The BATT indicator is displayed. Press N to the entry line. - or - The PAUSE indicator is displayed. A graph or program is paused and the TI-89 Titanium / Voyage 200 is displayed. The BUSY indicator is waiting for input; Press N several times to exit any menu ... see anything on the display. Suggested action: Press ¥ « to darken or ¥ | to be working properly. Refer to the list of Difficulty If you have difficulty operating the TI-89 Titanium / Voyage™ 200, the following suggestions may help you want to stop the calculation, press ´.


