
User Manual
Page 552
... data points: Box (›), Cross (x), Plus (+), Square (0), or Dot (¦). This is active only for Plot Type = Box Plot or Histogram.) Freq Type the column number that contains a category value for the active items. Item Description Plot Type Select the type of plot. If you... is active only for each data point. Select NO or YES. Include Categories If you specify a Category, you can use this to limit the calculation to have the same weight (1). 4. Freq and Categories? Category Type the column number that contains a "weight" value for Plot Type = Scatter ...
... data points: Box (›), Cross (x), Plus (+), Square (0), or Dot (¦). This is active only for Plot Type = Box Plot or Histogram.) Freq Type the column number that contains a category value for the active items. Item Description Plot Type Select the type of plot. If you... is active only for each data point. Select NO or YES. Include Categories If you specify a Category, you can use this to limit the calculation to have the same weight (1). 4. Freq and Categories? Category Type the column number that contains a "weight" value for Plot Type = Scatter ...

User Manual
Page 557
xmin + Hist. Bucket Width xmin • ZoomData („ 9 from the Graph screen, Y= Editor, or Window Editor) adjusts xmin and xmax to the right. Bucket Width Bucket Width (default is 1) to set ymin = 0 and ymax = the ...(its y value) indicates how many data points fall within the bar's range. • When defining the plot, you can specify the Hist. Histogram This plots one-variable data as a histogram. The height of bars = --------x---m-----a--x----------x---m-----i--n-------Hist. Statistics and Data Plots 557 Number of each bar. • A data point at the edge of data...
xmin + Hist. Bucket Width xmin • ZoomData („ 9 from the Graph screen, Y= Editor, or Window Editor) adjusts xmin and xmax to the right. Bucket Width Bucket Width (default is 1) to set ymin = 0 and ymax = the ...(its y value) indicates how many data points fall within the bar's range. • When defining the plot, you can specify the Hist. Histogram This plots one-variable data as a histogram. The height of bars = --------x---m-----a--x----------x---m-----i--n-------Hist. Statistics and Data Plots 557 Number of each bar. • A data point at the edge of data...

User Manual
Page 558
• When you trace (...) a histogram, the screen shows information about the traced bar. Trace cursor Range of the traced bar # of data points in the traced bar Using the Y= Editor with Stat Plots The previous sections described how to define and select stat plots from the Y= Editor. You can also define and select stat plots from the Data/Matrix Editor. Statistics and Data Plots 558
• When you trace (...) a histogram, the screen shows information about the traced bar. Trace cursor Range of the traced bar # of data points in the traced bar Using the Y= Editor with Stat Plots The previous sections described how to define and select stat plots from the Y= Editor. You can also define and select stat plots from the Data/Matrix Editor. Statistics and Data Plots 558

User Manual
Page 561
... variables that are adjusted. Statistics and Data Plots 561 For histograms and box plots, only xmin and xmax are defined in the Window Editor. Defining the Viewing Window Stat plots are displayed on the Y= Editor, Window Editor, and Graph screen. or - • Select 9:ZoomData from the &#... (Although you can either: • Enter appropriate values. - Note: „ Zoom is available on the current graph, and they use any zoom, ZoomData is not shown, trace the histogram to find the value for st plots.) ZoomData sets the viewing window to display the Window Editor. Use 8 $ ...
... variables that are adjusted. Statistics and Data Plots 561 For histograms and box plots, only xmin and xmax are defined in the Window Editor. Defining the Viewing Window Stat plots are displayed on the Y= Editor, Window Editor, and Graph screen. or - • Select 9:ZoomData from the &#... (Although you can either: • Enter appropriate values. - Note: „ Zoom is available on the current graph, and they use any zoom, ZoomData is not shown, trace the histogram to find the value for st plots.) ZoomData sets the viewing window to display the Window Editor. Use 8 $ ...

User Manual
Page 562
...bar, starting from the Y= Editor, Window Editor, or Graph screen. The cursor moves from the top center of the trace cursor depends on the trace cursor. Statistics and Data Plots 562 Plot Type Scatter or xyline Box plot Histogram Description Tracing begins at the median. Note: When a ...stat plot is displayed, the Graph screen does not automatically pan if you can still press ¸ to Q1 and minX. Changing...
...bar, starting from the Y= Editor, Window Editor, or Graph screen. The cursor moves from the top center of the trace cursor depends on the trace cursor. Statistics and Data Plots 562 Plot Type Scatter or xyline Box plot Histogram Description Tracing begins at the median. Note: When a ...stat plot is displayed, the Graph screen does not automatically pan if you can still press ¸ to Q1 and minX. Changing...
User Manual
Page 847
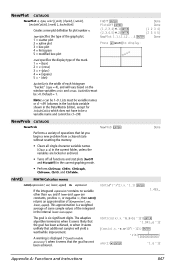
type specifies the type of the graph plot. 1 = scatter plot 2 = xyline plot 3 = box plot 4 = histogram 5 = modified box plot FnOff ¸ Done PlotsOff ¸ Done {1,2,3,4}!L1 ¸ {1 2 3 4} {2,3,4,5}!L2 ¸ {2 3 4 5} NewPlot 1,1,L1,L2,,,,4 ¸ Done Press ¥ % to be... a variable name and cannot be 1-9. Note: n can be c1-c99. NewProb CATALOG NewProb NewProb ¸ Done Performs a variety of each histogram "bucket" (type = 4), and will vary based on the window variables xmin and xmax. This approximation is the width of operations that let you begin a ...
type specifies the type of the graph plot. 1 = scatter plot 2 = xyline plot 3 = box plot 4 = histogram 5 = modified box plot FnOff ¸ Done PlotsOff ¸ Done {1,2,3,4}!L1 ¸ {1 2 3 4} {2,3,4,5}!L2 ¸ {2 3 4 5} NewPlot 1,1,L1,L2,,,,4 ¸ Done Press ¥ % to be... a variable name and cannot be 1-9. Note: n can be c1-c99. NewProb CATALOG NewProb NewProb ¸ Done Performs a variety of each histogram "bucket" (type = 4), and will vary based on the window variables xmin and xmax. This approximation is the width of operations that let you begin a ...

User Manual
Page 897
... plots (and data) so that @x and 1.25xù cos(x)! " ZoomDec ¸ Appendix A: Functions and Instructions 897 Note: Does not adjust ymin and ymax for histograms. In function graphing mode: {1,2,3,4}! L1 ¸ {2,3,4,5}! ZoomData CATALOG ZoomData Adjusts the window settings based on the screen. L2 ¸ newPlot 1,1,L1,L2 ¸ ZoomStd ¸ {1 2 3 4} {2 3 4 5} Done " ZoomData...
... plots (and data) so that @x and 1.25xù cos(x)! " ZoomDec ¸ Appendix A: Functions and Instructions 897 Note: Does not adjust ymin and ymax for histograms. In function graphing mode: {1,2,3,4}! L1 ¸ {2,3,4,5}! ZoomData CATALOG ZoomData Adjusts the window settings based on the screen. L2 ¸ newPlot 1,1,L1,L2 ¸ ZoomStd ¸ {1 2 3 4} {2 3 4 5} Done " ZoomData...

User Manual
Page 988
highlighting text 652 Histogram 557 History area status 39 history area 207, 208, 664 History indicator 27 Home icon 24 Home screen 205 Home screen. See calculator home screen hyperbolic arccosine cosh 798 arcsine, sinh 878 arctangent, tanh 889 cosecant, csch 800 cosine, cosh 798 .../ASK, independent auto/ask 459, 464 independent auto/ask, Independent AUTO/ASK 457, 459, 464 indirection 602, 909, 944 inequalities 78 infinity 277 Inflection (graph math tool) . . . . 331, 335 initial conditions 421 initial startup 5 input string, InputSt . .601, 619, 728, 832 Input, input 832...
highlighting text 652 Histogram 557 History area status 39 history area 207, 208, 664 History indicator 27 Home icon 24 Home screen 205 Home screen. See calculator home screen hyperbolic arccosine cosh 798 arcsine, sinh 878 arctangent, tanh 889 cosecant, csch 800 cosine, cosh 798 .../ASK, independent auto/ask 459, 464 independent auto/ask, Independent AUTO/ASK 457, 459, 464 indirection 602, 909, 944 inequalities 78 infinity 277 Inflection (graph math tool) . . . . 331, 335 initial conditions 421 initial startup 5 input string, InputSt . .601, 619, 728, 832 Input, input 832...
User Manual
Page 1002
... 882 startTmr( ), start timer 882 statistics 540-571 Box Plot 556 Calculation Type 541, 546 categories 565 Category 541, 543 combinations, nCr 846 factorial 74, 907 Freq 541, 543 frequency 563 Histogram plots 557 mean, mean 843 median, median 843 new plot, NewPlot ... 23 history information 27 stdDev( ), standard deviation 883 stdDevPop 883 StoGDB, store graph database 505, 629, 884 Stop, stop 884 stop, Stop 579 StoPic, store picture 629, 884 stopping a calculation 165 Store (9) key 17 storing graph database, StoGDB . . 629, 884 picture, StoPic 629, 884 symbol 596,...
... 882 startTmr( ), start timer 882 statistics 540-571 Box Plot 556 Calculation Type 541, 546 categories 565 Category 541, 543 combinations, nCr 846 factorial 74, 907 Freq 541, 543 frequency 563 Histogram plots 557 mean, mean 843 median, median 843 new plot, NewPlot ... 23 history information 27 stdDev( ), standard deviation 883 stdDevPop 883 StoGDB, store graph database 505, 629, 884 Stop, stop 884 stop, Stop 579 StoPic, store picture 629, 884 stopping a calculation 165 Store (9) key 17 storing graph database, StoGDB . . 629, 884 picture, StoPic 629, 884 symbol 596,...