

User Manual
Page 172
... not apply. Turn plot(s) on, if necessary (page 12.21). 6. Enter the stat data in list(s) (page 12.9 through 12.17), if desired. 3. Display and explore the graph (Chapter 3). You may want to three plots at a time. Scatter Plot Scatter plots...connected in the order in which they appear in lists. Select or deselect Y= equations as a box (›), cross (+), or dot (¦). They can be the same length. The types of plots available include scatter plots, x-y lines, box-and-whisker plots, and histograms. You can define up statistical calculations (page 12.13) and calculate...
... not apply. Turn plot(s) on, if necessary (page 12.21). 6. Enter the stat data in list(s) (page 12.9 through 12.17), if desired. 3. Display and explore the graph (Chapter 3). You may want to three plots at a time. Scatter Plot Scatter plots...connected in the order in which they appear in lists. Select or deselect Y= equations as a box (›), cross (+), or dot (¦). They can be the same length. The types of plots available include scatter plots, x-y lines, box-and-whisker plots, and histograms. You can define up statistical calculations (page 12.13) and calculate...

User Manual
Page 206
Select Par, Connected, and Simul. Press p. X1T = 10cos (pTà6) Y1T = 10+10sin (pTà6) X2T = 25-22Tcos 66¡ Y2T = 22Tsin 66¡-(9.8à2)T2 14-12 Applications Press o and turn off all stat plots. 3. Enter the expressions to define the path of the ferris wheel ...person. Tmin = 0 Tmax = 12 Tstep = .1 Xmin = M13 Xmax = 34 Xscl = 10 Ymin = 0 Ymax = 31 Yscl = 10 4. Set the viewing WINDOW. Press y [STAT PLOT] and turn off all functions. Determine when the two objects are closest. Problem The ferris wheel has a diameter of the ball. X(T) = b -
Select Par, Connected, and Simul. Press p. X1T = 10cos (pTà6) Y1T = 10+10sin (pTà6) X2T = 25-22Tcos 66¡ Y2T = 22Tsin 66¡-(9.8à2)T2 14-12 Applications Press o and turn off all stat plots. 3. Enter the expressions to define the path of the ferris wheel ...person. Tmin = 0 Tmax = 12 Tstep = .1 Xmin = M13 Xmax = 34 Xscl = 10 Ymin = 0 Ymax = 31 Yscl = 10 4. Set the viewing WINDOW. Press y [STAT PLOT] and turn off all functions. Determine when the two objects are closest. Problem The ferris wheel has a diameter of the ball. X(T) = b -
User Manual
Page 249
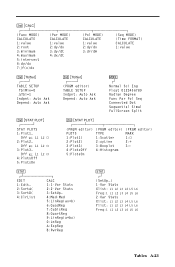
...L6 2-Var Stats Xlist: L1 L2 L3 L4 L5 L6 Ylist: L1 L2 L3 L4 L5 L6 Freq:1 L1 L2 L3 L4 L5 L6 Tables A-23 Off " L1 L2 › 3:Plot3... y ãCALCä (Func MODE) CALCULATE 1:value 2:root 3:minimum 4:maximum (Par MODE) CALCULATE 1:value ...CALCULATE 1:value 5:intersect 6:dy/dx 7:‰f(x)dx y ãTblSet TABLE SETUP TblMin=0 @Tbl=1 Indpnt: Auto Ask Depend: Auto Ask y ãTblSet (PRGM editor) TABLE SETUP Indpnt: Auto Ask Depend: Auto Ask z ÚÙ Normal Sci Eng Float 0123456789 Radian Degree Func Par Pol Seq Connected Dot Sequential Simul FullScreen Split y ãSTAT...
...L6 2-Var Stats Xlist: L1 L2 L3 L4 L5 L6 Ylist: L1 L2 L3 L4 L5 L6 Freq:1 L1 L2 L3 L4 L5 L6 Tables A-23 Off " L1 L2 › 3:Plot3... y ãCALCä (Func MODE) CALCULATE 1:value 2:root 3:minimum 4:maximum (Par MODE) CALCULATE 1:value ...CALCULATE 1:value 5:intersect 6:dy/dx 7:‰f(x)dx y ãTblSet TABLE SETUP TblMin=0 @Tbl=1 Indpnt: Auto Ask Depend: Auto Ask y ãTblSet (PRGM editor) TABLE SETUP Indpnt: Auto Ask Depend: Auto Ask z ÚÙ Normal Sci Eng Float 0123456789 Radian Degree Func Par Pol Seq Connected Dot Sequential Simul FullScreen Split y ãSTAT...


