User Manual
Page 4
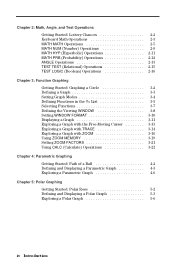
... Chapter 3: Function Graphing Getting Started: Graphing a Circle 3-2 Defining a Graph 3-3 Setting Graph Modes 3-4 Defining Functions in the Y= List 3-5 Selecting Functions 3-7 Defining the Viewing WINDOW 3-8 Setting WINDOW FORMAT 3-10 Displaying a Graph 3-11 Exploring a Graph with the Free-Moving Cursor ........ 3-13 Exploring a Graph with TRACE 3-14 Exploring a Graph with ZOOM 3-16 Using ZOOM MEMORY 3-19 Setting ZOOM FACTORS 3-21 Using CALC (Calculate) Operations 3-22 Chapter...
... Chapter 3: Function Graphing Getting Started: Graphing a Circle 3-2 Defining a Graph 3-3 Setting Graph Modes 3-4 Defining Functions in the Y= List 3-5 Selecting Functions 3-7 Defining the Viewing WINDOW 3-8 Setting WINDOW FORMAT 3-10 Displaying a Graph 3-11 Exploring a Graph with the Free-Moving Cursor ........ 3-13 Exploring a Graph with TRACE 3-14 Exploring a Graph with ZOOM 3-16 Using ZOOM MEMORY 3-19 Setting ZOOM FACTORS 3-21 Using CALC (Calculate) Operations 3-22 Chapter...
User Manual
Page 8
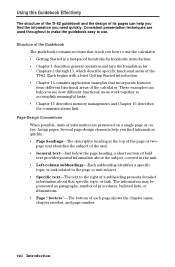
...use the calculator. ¦ Getting Started is a fast-paced keystroke-by-keystroke introduction. ¦ Chapter 1 describes general operation and lays the foundation for Chapters 2 through 13, which describe specific functional areas of the calculator. The information may be presented as paragraphs, numbered procedures, bulleted lists...Conventions When possible, units of bold text provides general information about that specific topic or task. Using this Guidebook Effectively The structure of the TI.82 guidebook and the design of each page shows the chapter name, chapter number, and page ...
...use the calculator. ¦ Getting Started is a fast-paced keystroke-by-keystroke introduction. ¦ Chapter 1 describes general operation and lays the foundation for Chapters 2 through 13, which describe specific functional areas of the calculator. The information may be presented as paragraphs, numbered procedures, bulleted lists...Conventions When possible, units of bold text provides general information about that specific topic or task. Using this Guidebook Effectively The structure of the TI.82 guidebook and the design of each page shows the chapter name, chapter number, and page ...

User Manual
Page 9
...which it is numbered; In this guidebook, each item with a "bullet" (¦) to highlight it-like this list. ¦ Tables and charts-Sets of related information are used to look up . Information-Mapping Conventions Several conventions are presented in tables or charts for more information. ¦ ...meanings, with problem-handling information. ¦ An alphabetical index at the back of the guidebook, listing tasks and topics you may choose one of several items have been used to help you look up specific information when you need to present information concisely and in an easily...
...which it is numbered; In this guidebook, each item with a "bullet" (¦) to highlight it-like this list. ¦ Tables and charts-Sets of related information are used to look up . Information-Mapping Conventions Several conventions are presented in tables or charts for more information. ¦ ...meanings, with problem-handling information. ¦ An alphabetical index at the back of the guidebook, listing tasks and topics you may choose one of several items have been used to help you look up specific information when you need to present information concisely and in an easily...

User Manual
Page 10
... and entering statistical data. It may be evaluated to a single answer. Menu items are shown on the TI.82 display. Expression Function Graph Database Graph Picture Home Screen Instruction List Matrix Menu Items Pixel Variable An expression is composed of the elements that can be saved as... value and can use for important terms that are not valid in expressions. The TI.82 display is the primary screen of values that the TI.82 can be entered and executed. x Introduction Instructions are used in an expression. A matrix is a set of the TI.82, where expressions can...
... and entering statistical data. It may be evaluated to a single answer. Menu items are shown on the TI.82 display. Expression Function Graph Database Graph Picture Home Screen Instruction List Matrix Menu Items Pixel Variable An expression is composed of the elements that can be saved as... value and can use for important terms that are not valid in expressions. The TI.82 display is the primary screen of values that the TI.82 can be entered and executed. x Introduction Instructions are used in an expression. A matrix is a set of the TI.82, where expressions can...
User Manual
Page 24
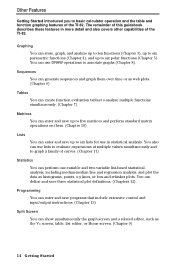
...three statistical plot definitions. (Chapters 12). You also can use lists to evaluate expressions at multiple values simultaneously and to graph a family of the TI.82. Graphing You can perform one-variable and two-variable list-based statistical analysis, including median-median line and regression analysis... Lists You can show simultaneously the graph screen and a related editor, such as histograms, points, x-y lines, or box-and-whisker plots. The remainder of the TI.82. Other Features Getting Started introduced you to basic calculator operation and the table and function graphing features...
...three statistical plot definitions. (Chapters 12). You also can use lists to evaluate expressions at multiple values simultaneously and to graph a family of the TI.82. Graphing You can perform one-variable and two-variable list-based statistical analysis, including median-median line and regression analysis... Lists You can show simultaneously the graph screen and a related editor, such as histograms, points, x-y lines, or box-and-whisker plots. The remainder of the TI.82. Other Features Getting Started introduced you to basic calculator operation and the table and function graphing features...
User Manual
Page 28
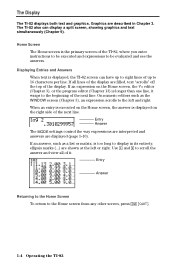
... 16 characters per line. Graphics are displayed (page 1.10). On numeric editors such as a list or matrix, is displayed, the TI.82 screen can display a split screen, showing graphics and text simultaneously (Chapter 9). Use ~ and | to scroll the answer and view all lines of the display are shown at ...the left and right. Displaying Entries and Answers When text is too long to display in Chapter 3. The TI.82 also can have up to eight lines of...
... 16 characters per line. Graphics are displayed (page 1.10). On numeric editors such as a list or matrix, is displayed, the TI.82 screen can display a split screen, showing graphics and text simultaneously (Chapter 9). Use ~ and | to scroll the answer and view all lines of the display are shown at ...the left and right. Displaying Entries and Answers When text is too long to display in Chapter 3. The TI.82 also can have up to eight lines of...
User Manual
Page 33
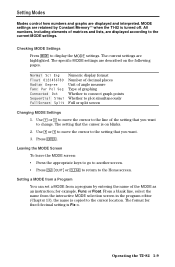
...of angle measure Type of matrices and lists, are highlighted. for fixed decimal setting is on the following pages. Setting Modes Modes control how numbers and graphs are described on blinks. 2. All numbers, including elements of graphing Whether to connect graph points Whether to change. Press Í....¦ Press y ãQUITä or ' to return to display the MODE settings. Use † or } to move the cursor to the line of the MODE as an instruction; Operating the TI.82 1-9 From a blank line, select the name from a program by Constant Memoryé when ...
...of angle measure Type of matrices and lists, are highlighted. for fixed decimal setting is on the following pages. Setting Modes Modes control how numbers and graphs are described on blinks. 2. All numbers, including elements of graphing Whether to connect graph points Whether to change. Press Í....¦ Press y ãQUITä or ' to return to display the MODE settings. Use † or } to move the cursor to the line of the MODE as an instruction; Operating the TI.82 1-9 From a blank line, select the name from a program by Constant Memoryé when ...
User Manual
Page 36
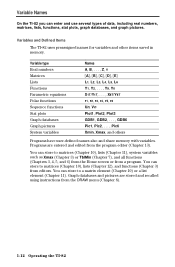
... screen or from the program editor (Chapter 13). You can enter and use several types of data, including real numbers, matrices, lists, functions, stat plots, graph databases, and graph pictures. Variables and Defined Items The TI.82 uses preassigned names for variables and other items saved in memory. Graph databases and pictures are entered and edited from a program.
... screen or from the program editor (Chapter 13). You can enter and use several types of data, including real numbers, matrices, lists, functions, stat plots, graph databases, and graph pictures. Variables and Defined Items The TI.82 uses preassigned names for variables and other items saved in memory. Graph databases and pictures are entered and edited from a program.
User Manual
Page 37
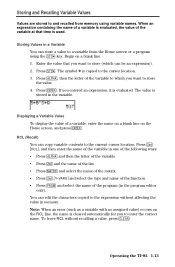
...166; Press ƒ and then the letter of the variable. ¦ Press y and the name of the list. ¦ Press Ž and select the name of the matrix. ¦ Press y ãY.VARSä... the Home screen, and press Í. The value is copied to the current cursor location. Operating the TI.82 1-13 You can copy variable contents to the cursor location. 3. The symbol ! Displaying a Variable Value ...To display the value of the variable to which you want to a variable from memory using the ¿ key. Press y ãRCLä, and then enter the name of the variable in...
...166; Press ƒ and then the letter of the variable. ¦ Press y and the name of the list. ¦ Press Ž and select the name of the matrix. ¦ Press y ãY.VARSä... the Home screen, and press Í. The value is copied to the current cursor location. Operating the TI.82 1-13 You can copy variable contents to the cursor location. 3. The symbol ! Displaying a Variable Value ...To display the value of the variable to which you want to a variable from memory using the ¿ key. Press y ãRCLä, and then enter the name of the variable in...
User Manual
Page 40
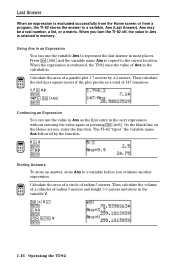
...TI.82 stores the answer to a variable before you turn the TI.82 off, the value in Ans is retained in memory. When the expression is evaluated, the TI.82 uses the value of Ans in the calculation. Calculate the area of radius 5 meters. The TI.82... "types" the variable name Ans followed by 4.2 meters. Then calculate... Then calculate the volume of a cylinder of 147 tomatoes. 1.7 ¯ 4.2 Í 147 ¥ y ãANSä Í Continuing an Expression You can use the...
...TI.82 stores the answer to a variable before you turn the TI.82 off, the value in Ans is retained in memory. When the expression is evaluated, the TI.82 uses the value of Ans in the calculation. Calculate the area of radius 5 meters. The TI.82... "types" the variable name Ans followed by 4.2 meters. Then calculate... Then calculate the volume of a cylinder of 147 tomatoes. 1.7 ¯ 4.2 Í 147 ¥ y ãANSä Í Continuing an Expression You can use the...
User Manual
Page 45
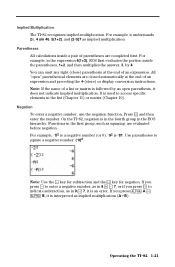
... Negation To enter a negative number, use the negation function. For example, MX2 is M81. Operating the TI.82 1-21 M92 is a negative number (or 0); Note: Use the ¹ key for subtraction and the Ì key for negation. Parentheses All calculations inside the parentheses, 1+2, and then... matrix is interpreted as implied multiplication. Press Ì and then enter the number. Functions in the list (Chapter 11) or matrix (Chapter 10). Use parentheses to indicate subtraction, as squaring, are evaluated before negation. All "open parenthesis, it understands 2p, 4 sin ...
... Negation To enter a negative number, use the negation function. For example, MX2 is M81. Operating the TI.82 1-21 M92 is a negative number (or 0); Note: Use the ¹ key for subtraction and the Ì key for negation. Parentheses All calculations inside the parentheses, 1+2, and then... matrix is interpreted as implied multiplication. Press Ì and then enter the number. Functions in the list (Chapter 11) or matrix (Chapter 10). Use parentheses to indicate subtraction, as squaring, are evaluated before negation. All "open parenthesis, it understands 2p, 4 sin ...
User Manual
Page 49
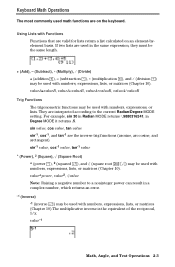
For example, sin 30 in Degree MODE it returns .5. value.1 Math, Angle, and Test Operations 2-3 Using Lists with Functions Functions that are interpreted according to a noninteger power can result in the same expression, they must be the same length.... may be used with numbers, expressions, lists, or matrices (Chapter 10). If two lists are used in a complex number, which returns an error. .1 (Inverse) .1 (inverse -) may be used math functions are the inverse trig functions (arcsine, arccosine, and arctangent). They are valid for lists return a list calculated on the ...
For example, sin 30 in Degree MODE it returns .5. value.1 Math, Angle, and Test Operations 2-3 Using Lists with Functions Functions that are interpreted according to a noninteger power can result in the same expression, they must be the same length.... may be used with numbers, expressions, lists, or matrices (Chapter 10). If two lists are used in a complex number, which returns an error. .1 (Inverse) .1 (inverse -) may be used math functions are the inverse trig functions (arcsine, arccosine, and arctangent). They are valid for lists return a list calculated on the ...

User Manual
Page 230
...CubicReg CubicReg Xlist,Ylist CubicReg Xlist,Ylist,Flist value8Dec list8Dec matrix8Dec Degree Degree notation: angle¡ DependAsk DependAuto det matrix dim list dim matrix length!dim listname {row,col}!dim matrixname Disp Disp valueA,valueB, . . . CALC áCubicRegâ... I/O áDispâ . . . (I) 13.14 Displays graph. (I) † I/O áDispGraphâ 13.15 Displays table. (I) † I ) ... CALC áCubicRegâ 12.15 Fits Xlist and Ylist to cubic model using lists from SET UP CALCS. (I ) ... DispGraph DispTable Fits data to cubic model...
...CubicReg CubicReg Xlist,Ylist CubicReg Xlist,Ylist,Flist value8Dec list8Dec matrix8Dec Degree Degree notation: angle¡ DependAsk DependAuto det matrix dim list dim matrix length!dim listname {row,col}!dim matrixname Disp Disp valueA,valueB, . . . CALC áCubicRegâ... I/O áDispâ . . . (I) 13.14 Displays graph. (I) † I/O áDispGraphâ 13.15 Displays table. (I) † I ) ... CALC áCubicRegâ 12.15 Fits Xlist and Ylist to cubic model using lists from SET UP CALCS. (I ) ... DispGraph DispTable Fits data to cubic model...

User Manual
Page 232
...elements. (F) 2.12 Stores value to each element in matrixname. (I) Ž MATH áFill(â 10.13 Stores value to exponential model using lists from SET UP CALCS. (I ) † z áFloatâ 1.10 Returns value of variable MATH where maximum of &#...225;fMax(â expression occurs, between lower and upper, with frequency Flist.(I ) ... Factorial: list! Fill(value,matrixname) Fill(value,listname) Fix # Float fMax(expression,variable, lower,upper) fMax(expression,variable, lower,upper,tolerance) Returns value...
...elements. (F) 2.12 Stores value to each element in matrixname. (I) Ž MATH áFill(â 10.13 Stores value to exponential model using lists from SET UP CALCS. (I ) † z áFloatâ 1.10 Returns value of variable MATH where maximum of &#...225;fMax(â expression occurs, between lower and upper, with frequency Flist.(I ) ... Factorial: list! Fill(value,matrixname) Fill(value,listname) Fix # Float fMax(expression,variable, lower,upper) fMax(expression,variable, lower,upper,tolerance) Returns value...

User Manual
Page 236
LabelOff Sets axis label FORMAT † p FORMAT off. (I) áLabelOffâ 3.10 LabelOn Sets axis label FORMAT † p FORMAT on. (I) áLabelOnâ 3.10 Lbl label Assigns label to the command. (I) † CTL áLblâ 13.10 Less than: valueA
LabelOff Sets axis label FORMAT † p FORMAT off. (I) áLabelOffâ 3.10 LabelOn Sets axis label FORMAT † p FORMAT on. (I) áLabelOnâ 3.10 Lbl label Assigns label to the command. (I) † CTL áLblâ 13.10 Less than: valueA

User Manual
Page 237
... Flist. (I ) 12.15 Fits Xlist and Ylist to ... CALC median model using lists áMed-Medâ from SET UP CALCS. (I ) ... y ãLISTä MATH (F) ámean(â 11.9 Returns the mean of list y ãLISTä MATH with frequency Flist. (F) ámedian(â 11.9 Sets up ...smaller of valueA NUM ámin(â and valueB. (F) 2.10 Returns smallest element y ãLISTä MATH in list. (F) ámin(â 11.9 Returns list of smaller of y ãLISTä MATH each pair of elements in ámin(â listA and listB. (F) 11.9 Tables A-11 ...
... Flist. (I ) 12.15 Fits Xlist and Ylist to ... CALC median model using lists áMed-Medâ from SET UP CALCS. (I ) ... y ãLISTä MATH (F) ámean(â 11.9 Returns the mean of list y ãLISTä MATH with frequency Flist. (F) ámedian(â 11.9 Sets up ...smaller of valueA NUM ámin(â and valueB. (F) 2.10 Returns smallest element y ãLISTä MATH in list. (F) ámin(â 11.9 Returns list of smaller of y ãLISTä MATH each pair of elements in ámin(â listA and listB. (F) 11.9 Tables A-11 ...

User Manual
Page 239
...Otherwise, returns 0. (F) 2.15 Returns 1 if matrixA element ƒ matrixB element. CALC á1-Var Statsâ 12.14 Performs one -variable ... CALC analysis using lists from Ylist. (I) 12.14 Returns 1 if valueA or valueB is ƒ 0. y ãTESTä LOGIC (F) ánotâ 2.16 Returns 1... beginning † I/O áOutput(â at a time. (F) PRB ánPrâ 2.12 Performs one-variable analysis using Xlist and a á1-Var Statsâ frequency of items (0integer) taken number (0integer) at specified line and column. (I) 13.15...
...Otherwise, returns 0. (F) 2.15 Returns 1 if matrixA element ƒ matrixB element. CALC á1-Var Statsâ 12.14 Performs one -variable ... CALC analysis using lists from Ylist. (I) 12.14 Returns 1 if valueA or valueB is ƒ 0. y ãTESTä LOGIC (F) ánotâ 2.16 Returns 1... beginning † I/O áOutput(â at a time. (F) PRB ánPrâ 2.12 Performs one-variable analysis using Xlist and a á1-Var Statsâ frequency of items (0integer) taken number (0integer) at specified line and column. (I) 13.15...

User Manual
Page 241
CALC using lists from SET UP áPwrRegâ CALCS. (I) 12.16 Fits Xlist ...,column) Pxl.On(row,column) pxl.Test(row,column) QuadReg QuadReg Xlist,Ylist QuadReg Xlist,Ylist,Flist Returns product of list elements. (F) y ãLISTä MATH áprodâ 11.10 Prompts for value for † I/O varA, then varB,...row62 and 0column94. (F) 8.13 Fits data to quadratic model using lists from SET UP CALCS. (I ) ... CALC áQuadRegâ 12.15 Tables A-15 prod list Prompt varA,varB, . . . CALC áPwrRegâ 12.16 Changes pixel at...
CALC using lists from SET UP áPwrRegâ CALCS. (I) 12.16 Fits Xlist ...,column) Pxl.On(row,column) pxl.Test(row,column) QuadReg QuadReg Xlist,Ylist QuadReg Xlist,Ylist,Flist Returns product of list elements. (F) y ãLISTä MATH áprodâ 11.10 Prompts for value for † I/O varA, then varB,...row62 and 0column94. (F) 8.13 Fits data to quadratic model using lists from SET UP CALCS. (I ) ... CALC áQuadRegâ 12.15 Tables A-15 prod list Prompt varA,varB, . . . CALC áPwrRegâ 12.16 Changes pixel at...

User Manual
Page 242
... Picn RectGC Repeat condition :commands:End Return nthrootx‡value nthrootx‡list listx‡value listAx‡listB round(value) round(value,#decimals) round(list) Fits data to quartic model using lists from SET UP CALCS. (I) Fits Xlist and Ylist to quartic model.... (I) Fits Xlist and Ylist to quartic model with frequency Flist. (I) Interprets angle as radians. (F) Sets radian MODE. (I) Returns random number between 0 and 1. (F) Returns a rows (1-99) × columns (1-99) random matrix. (F) Recalls graph...
... Picn RectGC Repeat condition :commands:End Return nthrootx‡value nthrootx‡list listx‡value listAx‡listB round(value) round(value,#decimals) round(list) Fits data to quartic model using lists from SET UP CALCS. (I) Fits Xlist and Ylist to quartic model.... (I) Fits Xlist and Ylist to quartic model with frequency Flist. (I) Interprets angle as radians. (F) Sets radian MODE. (I) Returns random number between 0 and 1. (F) Returns a rows (1-99) × columns (1-99) random matrix. (F) Recalls graph...

User Manual
Page 247
...225;Zoom Outâ 3.17 Displays graph in new viewing WINDOW. (I) q ZOOM áZoomRclâ 3.19 Displays graph in new viewing WINDOW. (I) q ZOOM áZoomStoâ 3.19 Displays graph in new viewing WINDOW. (I) q ZOOM áZoomStatâ 3.18 Displays graph in new viewing WINDOW. (I) q ... Out ZoomRcl ZoomSto ZoomStat ZPrevious ZSquare ZStandard ZTrig Performs two-variable ... CALC analysis using lists from á2-Var Statsâ SET UP CALCS menu. (I) 12.14 Performs two-variable analysis using Xlist and á2-Var Statsâ Ylist with frequency Flist. (I ) q...
...225;Zoom Outâ 3.17 Displays graph in new viewing WINDOW. (I) q ZOOM áZoomRclâ 3.19 Displays graph in new viewing WINDOW. (I) q ZOOM áZoomStoâ 3.19 Displays graph in new viewing WINDOW. (I) q ZOOM áZoomStatâ 3.18 Displays graph in new viewing WINDOW. (I) q ... Out ZoomRcl ZoomSto ZoomStat ZPrevious ZSquare ZStandard ZTrig Performs two-variable ... CALC analysis using lists from á2-Var Statsâ SET UP CALCS menu. (I) 12.14 Performs two-variable analysis using Xlist and á2-Var Statsâ Ylist with frequency Flist. (I ) q...


